Hello! Welcome back to your course on Linux system administration.
In our last lesson, you learned to configure a static IP address using nmcli. We finished by using the ping command to quickly test if your newly configured machine could reach your router and the internet. Today, we'll explore ping and its companion, traceroute, in much greater detail.
These two commands are fundamental tools in any system administrator's or web developer's toolkit. When your Django application can't connect to its database, or users can't reach your web server, ping and traceroute are your first-line diagnostic tools to answer two critical questions: "Is the server online?" and "Where is the connection failing along the way?"
By the end of this lesson, you will be able to test network reachability with ping and trace the network path to a destination with traceroute.
1. ping: Your Network Sonar
The ping command is the simplest way to check if a remote host is reachable. It works by sending a special network packet called an ICMP Echo Request to the destination. If the destination host is online and configured to respond, it sends back an ICMP Echo Reply.
To get a quick overview of what ping is and what it's used for, let's start with a video.
Linux Crash Course - The ping Command
This video from Learn Linux TV provides an excellent, beginner-friendly introduction to the ping command, its purpose, and its basic function.
Watch from the beginning to 5:42. This segment explains what ping does, how it works, and demonstrates its most basic usage with both an IP address and a domain name.
Basic Usage and Output
As you saw in the video, using ping is straightforward. Open your terminal and try it:
ping google.com
You'll see a continuous stream of replies. Press Ctrl+C to stop it.
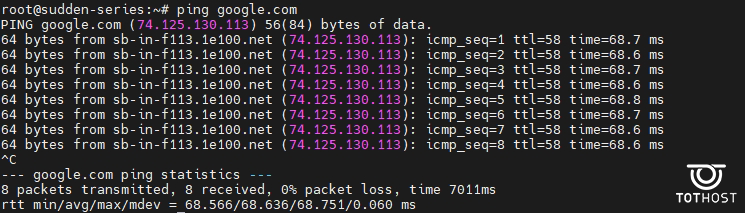
Let's break down a single line of the output:64 bytes from lhr48s15-in-f14.1e100.net (142.250.187.206): icmp_seq=1 ttl=117 time=13.6 ms
from: The hostname and IP address of the machine that replied.icmp_seq: The sequence number.pingsends packets sequentially, so you can see if any were lost.ttl: Time To Live. This is a value that decreases at each network hop. It prevents packets from looping forever on the internet.time: The Round-Trip Time (RTT). This is how long it took for the packet to go to the destination and come back. This is a key measure of network latency.
When you press Ctrl+C, you get a summary:
packet loss: The percentage of packets that were sent but never received a reply. Anything above 0% might indicate a network problem.rtt min/avg/max/mdev: Statistics for the round-trip time, giving you an idea of the best, worst, and average latency.
Practical ping Techniques
By default, ping on Linux runs forever. For scripting or quick tests, you often want to send a specific number of pings. You can do this with the -c (count) option.
The video you watched earlier also covers some very practical troubleshooting scenarios. Let's focus on two key ones: limiting the ping count and diagnosing DNS issues.
Linux Crash Course - The ping Command
Let's return to the video to see how to control the number of pings and use this command to distinguish between a general internet failure and a DNS-specific problem.
Watch the sections on limiting the ping count (06:45 - 08:10) and using ping to test your internet connection vs. DNS (09:54 - 11:53).
As demonstrated, pinging a reliable IP address like 8.8.8.8 (one of Google's public DNS servers) is a classic way to test for raw internet connectivity. If ping 8.8.8.8 works but ping google.com fails, you can be almost certain you have a DNS resolution problem, not a general network outage.
2. traceroute: Mapping the Journey
While ping tells you if you can reach a destination, traceroute shows you the path your packets take to get there. It lists all the routers (or "hops") your packet passes through on its way to the destination. This is incredibly useful for diagnosing where a network problem is located.
Installing traceroute
traceroute may not be installed on your Fedora system by default. You can install it easily using dnf.
Installing traceroute on Fedora
The following article from DataFlair provides a clear command for installing traceroute on Fedora-based systems.
Find the section titled 'Installing traceroute on Fedora-based Linux operating systems' and run the provided sudo dnf install traceroute command in your terminal.
How traceroute Works
traceroute uses a clever trick with the Time To Live (TTL) field you saw in the ping output. It sends out a series of packets.
- The first packet has a TTL of 1. It reaches the first router, which decrements the TTL to 0. The router discards the packet and sends back an ICMP "Time Exceeded" message.
traceroutenow knows the address of the first hop. - The second packet has a TTL of 2. It passes the first router (which decrements TTL to 1) and reaches the second router. The second router decrements the TTL to 0 and sends back a "Time Exceeded" message.
traceroutenow knows the address of the second hop. - This continues, increasing the TTL by one each time, until the packet finally reaches the destination.
This video provides an excellent and detailed visual explanation of this process.
Traceroute explained // Featuring Elon Musk // Demo with Windows, Linux, macOS
This video from David Bombal uses network analysis tools to show you exactly how the TTL trick works and how traceroute builds its map of the network path.
Watch from 04:03 to 07:44. This segment is a technical deep-dive that clearly explains and demonstrates the TTL mechanism at the heart of traceroute.
Basic Usage and Output
Now that you've installed it, run a traceroute:
traceroute google.com

Let's dissect the output for a single hop:2 my.router.name (192.168.1.1) 1.234 ms 1.567 ms 1.890 ms
- Hop Number:
2is the second router in the path. - Hostname and IP: The name and IP address of the router at this hop.
- Probe Times:
traceroutesends three probe packets for each hop by default. These three columns show the round-trip time for each probe.
If you see * * * for a hop, it means that router didn't respond to the probes. This could be due to a firewall or high load on the router.
3. Do-It-Yourself: Network Diagnostics
Time to apply these concepts. Open your terminal and follow along.
Task 1: Check Local and Remote Reachability
- Ping your gateway: First, find your router's IP address with
ip route | grep default. Then ping it. The time should be very low (typically < 2ms). This confirms your local network connection is working.# Example ping to a router ping -c 4 192.168.1.1 - Ping a remote server: Now, check your connection to the internet.
Note the average time. Is it higher than the ping to your router? It should be, as the packets are traveling much farther.ping -c 4 google.com
Task 2: Simulate and Diagnose a DNS Failure
Let's simulate a common issue for web developers: a DNS problem. We'll use nmcli from the previous lesson to point your system to a non-existent DNS server.
-
Find your connection name:
nmcli connection show --active -
Modify the DNS server: Replace
"Your-Connection-Name"with your actual connection name. We'll use an IP address that is unlikely to be a real DNS server.sudo nmcli connection modify "Your-Connection-Name" ipv4.dns "10.255.255.1" -
Apply the change:
sudo nmcli connection up "Your-Connection-Name" -
Test and diagnose:
- Try to ping a domain name:
ping -c 4 google.com. This should fail with an error likeTemporary failure in name resolutionorName or service not known. - Now, try to ping a public IP address:
ping -c 4 1.1.1.1(Cloudflare's DNS server). This should succeed! - Conclusion: You've just proven that your internet connection is working, but your system is unable to resolve domain names. This is a classic diagnostic step.
- Try to ping a domain name:
-
Revert the change: Let's fix your DNS settings.
sudo nmcli connection modify "Your-Connection-Name" ipv4.dns "8.8.8.8 1.1.1.1"
sudo nmcli connection up "Your-Connection-Name"
Verify that you can ping
google.comagain.
Task 3: Trace the Path
Now, let's use traceroute to see how you connect to different parts of the world.
-
Trace to a familiar site:
traceroute google.comObserve the path. The first hop should be your local router. The next few might be within your Internet Service Provider's (ISP) network.
-
Trace to a distant site: Let's try tracing to a server in Australia.
traceroute unimelb.edu.auCompare this trace to the one for
google.com. You should see more hops and a significant increase in latency (themsvalues) as the packets cross oceans. -
Speed up the trace: Sometimes, looking up the hostname for each hop can be slow. You can use the
-noption to display only IP addresses.traceroute -n google.comNotice how this completes much faster.
Conclusion
In this lesson, you've added two of the most essential network diagnostic commands to your arsenal. You've not only learned what they do but also how to interpret their output to solve real-world problems.
Key Takeaways:
pingis your go-to tool to quickly test if a host is online and responsive. It measures reachability and latency.traceroutemaps the step-by-step path your packets take to a destination, helping you pinpoint the location of network delays or failures.- By using
pingwith both domain names and IP addresses, you can effectively distinguish between network connectivity issues and DNS resolution problems. - The
TTLfield in an IP packet is the key mechanism that allowstracerouteto discover the path hop-by-hop.
You now have a strong grasp of Layer 3 (Network Layer) troubleshooting. In our next lesson, we will move up the networking stack to the Application Layer. You will learn to use curl to test web service availability, inspect HTTP responses, and interact with web servers directly from the command line—an indispensable skill for any web developer.