Introduction
In our last lesson, we brought together all the different interest rate curves—YTM, spot, forward, and par—and visualized them on a single plot. We established their strict mathematical ordering and demonstrated why the spot curve is the theoretically pure foundation for valuation, free from the "coupon effect" that contaminates a simple plot of YTMs.
Now that we can construct and analyze these curves, we will turn to their economic significance. This lesson addresses what the shape of the yield curve reveals about the state of the economy. You will learn to interpret normal, inverted, flat, and humped yield curves as powerful signals of market expectations for future economic growth, inflation, and monetary policy. This will connect our rigorous mathematical framework to the practical world of macroeconomic analysis.
1. The Building Blocks of Yield Curve Shapes
From a quantitative perspective, any movement in the yield curve can be decomposed into a few fundamental factors. Research, notably through techniques like Principal Component Analysis (PCA) which will be familiar from your data science background, has shown that over 95% of the variation in the term structure can typically be explained by three main factors:
- Level: A parallel shift up or down in the entire curve. A change in the level factor affects all yields similarly. This is often driven by changes in long-term inflation expectations and the market's perception of the overall economic climate.
- Slope (or Steepness): A change in the spread between long-term and short-term yields. A "steepening" curve means long rates are rising faster than short rates, while "flattening" means the opposite. The slope is highly sensitive to the business cycle and expectations of future central bank policy.
- Curvature: A change in how "bowed" the curve is. A positive curvature change would make a humped curve even more pronounced. This factor is often associated with market uncertainty about the future path of interest rates and inflation.
Thinking in terms of these factors helps to structure our analysis of the specific shapes the yield curve can take.
2. Theories of the Term Structure
To understand why the yield curve has a particular shape, we need to consider the economic theories that explain the relationship between yields at different maturities. The following short video provides an excellent overview of the three primary theories.
3 Theories Explaining the Shape of the Yield Curve
This Edspira video concisely explains the three main theories of the term structure.
Watch the video from the beginning to the end. As you watch, focus on understanding the core premise of each theory: Expectations Theory: How are long-term rates related to future short-term rates? Market Segmentation Theory: How do supply and demand dynamics for different maturities affect the curve? Liquidity Premium Theory: How does this theory combine the first two to provide a more complete picture?
Let's summarize and formalize these ideas:
- Expectations Hypothesis: This theory posits that a long-term interest rate is the (geometric) average of the current short-term rate and the expected future short-term rates over the life of the long-term bond. This directly connects to the forward rates we calculated; under this theory, the forward rate is the market's unbiased forecast of the future spot rate at time . An upward-sloping curve implies expectations of rising short-term rates, while an inverted curve implies expectations of falling rates.
- Liquidity Premium Theory: This is a refinement of the expectations hypothesis. It argues that investors demand a risk premium—the liquidity premium—for holding longer-term bonds to compensate for higher interest rate risk (duration) and lower liquidity. Therefore, the observed long-term rate includes both the expected future rates and this premium. This explains why the yield curve is normally upward-sloping, even if the market expects rates to remain flat.
- Market Segmentation Theory: This theory proposes that the bond market is "segmented" by maturity. Different investors have different preferred habitats (e.g., banks prefer short-term assets, pension funds prefer long-term assets). The yield at any given maturity is determined solely by the supply and demand within that segment, independent of others. This theory is particularly useful for explaining anomalies like humps or dips in the curve that the other theories struggle with.
In practice, all three theories contribute to the final shape of the yield curve. The Expectations and Liquidity Premium theories usually explain the broad shape (slope), while Market Segmentation can explain more localized features (curvature).
3. Interpreting Yield Curve Shapes
With this theoretical foundation, we can now interpret the economic meaning of the most common yield curve shapes. The video below gives a practical overview of what normal and inverted curves signify for the economy.
Yield Curve Inversion!? Flattening Yield Curve Explained
This video from Macro Ops explains the economic signals of normal, flat, and inverted yield curves.
First, watch the section on the normal yield curve. Note the dual forces at play: the central bank's influence on short-term rates and investor expectations influencing long-term rates. Next, watch the segment on flat and inverted curves. Pay close attention to how the combination of central bank tightening and negative investor sentiment leads to an inversion.
Let's now take a deeper, more systematic look at each shape, incorporating insights from the academic paper "Shapes and Transitions of the Interest Rate Term Structure" by Biwei Chen, which provides a rigorous analysis of the link between curve shapes and macroeconomic data.
Shapes and Transitions of the Interest Rate Term Structure
This paper statistically links yield curve shapes to business cycles and economic states.
Please read the following two subsections from Section 4 of the paper: Start with Section 4.1 "Links to business cycles" (starts on page 6). Focus on the key findings summarized in Table 3 and Table 5. Notice how the frequency of "minor" shapes (flat, hump, bowl, downward) increases significantly before a recession. Next, read Section 4.2 "Links to economic states" (starts on page 10). Pay attention to the final paragraph of this section, where the author maps each curve shape to a specific combination of inflation and output growth.
Synthesizing these resources, we can build a detailed map from shape to economic meaning.
Normal (Upward-Sloping) Curve
- Description: Short-term yields are lower than long-term yields. This is the most common shape, occurring over 70% of the time according to the Chen paper.
- Interpretation: Signals a healthy, expanding economy.
- Monetary Policy: The central bank is typically holding short-term rates low to stimulate borrowing and investment.
- Growth & Inflation: Investors expect economic growth to continue, leading to potentially higher inflation in the future.
- Investor Behavior: To compensate for future inflation risk and to lock in yields before rates potentially rise, investors demand higher yields for longer-maturity bonds. The liquidity premium also contributes to this upward slope.
Inverted (Downward-Sloping) Curve
- Description: Short-term yields are higher than long-term yields.
- Interpretation: This is the most reliable predictor of an upcoming recession.
- Monetary Policy: The central bank has likely raised short-term rates significantly to combat high inflation and cool down an "overheating" economy.
- Growth & Inflation: Investors anticipate that this tight monetary policy will slow the economy, potentially leading to a recession and lower future inflation.
- Investor Behavior: Fearing an economic downturn and stock market decline, investors engage in a "flight to safety," buying long-term government bonds. This high demand pushes the prices of long-term bonds up and their yields down, below short-term rates. The expectations theory is dominant here: the market is pricing in future rate cuts by the central bank to fight the anticipated recession.
Flat Curve
- Description: Short-term and long-term yields are very close to each other.
- Interpretation: A transitional or uncertain state.
- Flattening Curve: This often occurs late in an economic expansion as the central bank starts raising short-term rates, while long-term rates rise more slowly (or not at all) as investors begin to worry about future growth. This is a common precursor to an inverted curve.
- Economic State: The Chen paper links the flat curve to a state of moderate inflation but the highest output growth, suggesting it can occur at the very peak of a business cycle just before a slowdown.
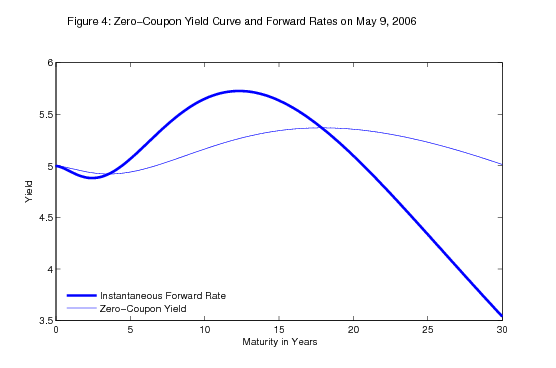
Humped Curve
- Description: Medium-term yields (e.g., 2-10 years) are higher than both short-term and long-term yields.
- Interpretation: This shape often reflects market uncertainty about the medium-term path of monetary policy.
- Monetary Policy Expectations: The market might expect the central bank to raise rates in the near future but then be forced to cut them again in the longer term. For example, the market anticipates a rate hike to fight inflation but believes this hike will trigger a slowdown, necessitating a subsequent reversal.
- Economic State: The paper suggests this shape can reflect a state of relatively high inflation and low output growth—a stagflationary environment.
4. The Yield Curve in Motion
The yield curve is not static; its shape evolves continuously in response to economic data, central bank actions, and shifts in investor sentiment. The following 3D plot visualizes this dynamic nature over a 14-year period covering major economic events.

Looking at this chart, you can identify key periods:
- Pre-2008: Notice the flattening and inverting curve leading into the 2008 financial crisis.
- Post-2008: Observe the steep, upward-sloping "normal" curve as the Federal Reserve kept short-term rates near zero to stimulate recovery (a policy known as ZIRP - Zero Interest-Rate Policy).
- Late 2010s: See the curve begin to flatten again as the Fed started to raise rates before the COVID-19 pandemic.
This visualization powerfully illustrates how the interpretations we've discussed manifest in real-world data over time.
Conclusion
In this lesson, we moved from the mathematics of yield curves to their potent economic interpretations. You are now able to analyze the term structure not just as a set of interest rates, but as a rich, forward-looking indicator of economic health.
Key Takeaways:
- Shape as a Signal: The shape of the yield curve consolidates the collective wisdom of the market regarding future growth, inflation, and monetary policy.
- Normal Curve (Upward-Sloping): Signals economic expansion and is the most common state.
- Inverted Curve (Downward-Sloping): A powerful predictor of an impending recession, reflecting tight monetary policy and a flight to safety in long-term bonds.
- Flat and Humped Curves: Represent transitional or uncertain states, often reflecting shifts in central bank policy expectations or unique supply/demand dynamics.
- Underlying Theories: The Expectations, Liquidity Premium, and Market Segmentation theories provide the framework for understanding why these shapes occur.
This concludes our module on synthesizing and interpreting yield curves. You have built a complete toolkit from the ground up, starting with pricing a single bond and culminating in the construction and macroeconomic interpretation of the entire term structure.
In our next module, we will begin to apply this sophisticated understanding of the term structure to price more complex fixed-income instruments, starting with Floating Rate Notes.