Hello! Welcome back.
In our last lesson, you got hands-on with server hardware, physically replacing components like hot-swappable drives and PSUs. That's a crucial skill when you're standing in front of a server. But what if the server is in a different rack, a different room, or even a different country?
This lesson addresses exactly that scenario. We'll focus on how to manage and monitor server hardware remotely, which is the foundation of modern data center operations. This fulfills the learning outcome: Access a server's remote management interface (IPMI/iLO/iDRAC) to monitor hardware health and logs.
You'll learn about the "magic" that lets you see a server's temperature, fan speeds, and event logs, even if the main operating system has crashed. This is a topic that frequently comes up in technical interviews, and mastering it demonstrates a deep understanding of server management.
1. The Computer Inside Your Computer: The BMC
The key to remote management is a special, dedicated processor on the server's motherboard called the Baseboard Management Controller (BMC). Think of it as a small, self-sufficient computer whose only job is to monitor and manage the main server.
Because you have a background in electronics and communication engineering, you can think of the BMC as a dedicated microcontroller-based subsystem. It has its own firmware, processor, and memory, and it operates completely independently of the server's main CPU, RAM, and operating system. This independence is what makes it so powerful.
To get a quick overview of what a BMC is and why it's so critical, let's watch a short video.
What is BMC - Baseboard Management Controller
This video from Professor Linux provides a concise explanation of the Baseboard Management Controller (BMC), its independence from the main server components, and its role in remote management.
Watch the first minute and 19 seconds of the video (from 00:00 to 01:19). Pay attention to the explanation of why the BMC is useful even when the main OS is down, and the difference between a shared and a dedicated network port for management.
As the video mentioned, the BMC is typically accessed via a dedicated network port on the back of the server. This creates an out-of-band (OOB) management network, separate from the main data network, ensuring you can always reach the server's management interface.
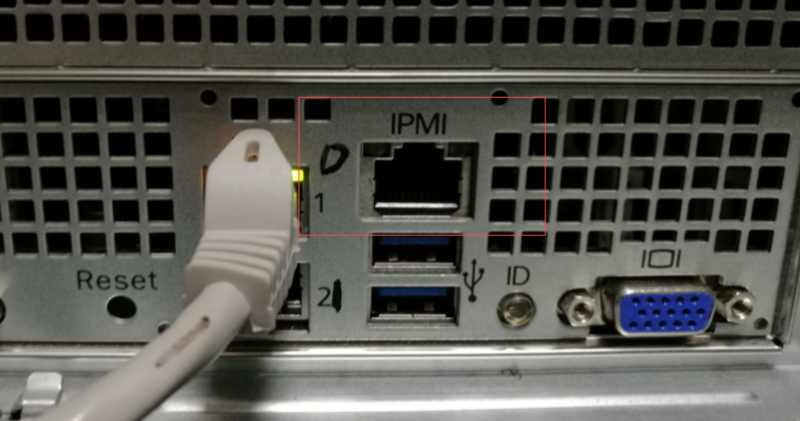
The entire architecture is designed for robust, independent monitoring.

2. IPMI, iDRAC, and iLO: Standards and Implementations
The BMC hardware needs a standard way to communicate. The open industry standard for this is the Intelligent Platform Management Interface (IPMI). However, major server vendors have built their own enhanced, proprietary implementations on top of IPMI, which you'll encounter constantly:
- iDRAC (integrated Dell Remote Access Controller): Dell's management platform.
- iLO (Integrated Lights-Out): Hewlett Packard Enterprise's (HPE) platform.
While the names and web interfaces differ, they all provide the same core capabilities dictated by IPMI: monitoring hardware health, viewing logs, and remote control. In this lesson, we will look at both the standard IPMI command-line approach and the graphical interface of Dell's iDRAC.
3. The Command-Line "Katana": ipmitool
For anyone serious about Linux and server administration, the command line is essential. The standard tool for interacting with the BMC via IPMI is ipmitool. It's powerful, scriptable, and allows you to manage thousands of servers programmatically.
Let's get practical and explore how to use it.
A. Installation and Initial Checks
First, you need to have the tool installed on a Linux system from which you want to manage other servers.
[ Linux ] IPMITool Cheat Sheet
This cheat sheet from Exxact Corp provides the basic commands to install ipmitool on common Linux distributions.
Review the first set of commands under the 'Commands:' heading, titled 'Installing IPMITool'. This shows you how to install the package on CentOS/Rocky and Ubuntu.
Once installed, you can use ipmitool to manage the server you're on (local) or a different server over the network (remote). The following resource provides a great introduction to the tool's functions and how to use it for remote access.
Monitor the System Event Log with ipmitool
This HPE support document explains the fundamentals of IPMI and shows practical examples of using ipmitool, including how to structure commands for remote access.
Please read the following three sections: The introductory section, including 'Functions of ipmitool'. This will solidify your understanding of what IPMI does. 'Remote system IP address'. This explains how to find the BMC's IP address, which is crucial. 'Run ipmitool on a Remote System'. Focus on the command syntax, especially the -H, -I, -U, and -P options for Host, Interface, User, and Password. We will use these in the examples below.
B. Monitoring Hardware Health and Logs
Now, let's use ipmitool to achieve our lesson's goal. Imagine you are logged into a management workstation and need to check the status of a server with the BMC IP address 192.168.1.100.
1. Viewing the System Event Log (SEL)
The SEL is the BMC's logbook. It records important hardware events like power cycles, fan failures, memory errors, or chassis intrusion. This is often the first place you'll look when troubleshooting a hardware issue.
To view the log on the remote server:
# Syntax: ipmitool -I lanplus -H <IP_ADDRESS> -U <USER> -P <PASSWORD> sel list
ipmitool -I lanplus -H 192.168.1.100 -U admin -P password sel list
This command will print a list of all recorded events with timestamps, which is invaluable for diagnostics. The -I lanplus part specifies that we're using the standard IPMI v2.0 protocol over the network.
2. Checking Sensor Readings
To get a real-time snapshot of the server's health, you can query its sensors. This includes temperatures, fan speeds, and voltage levels.
To list all sensor readings:
# Syntax: ipmitool -I lanplus -H <IP_ADDRESS> -U <USER> -P <PASSWORD> sensor list
ipmitool -I lanplus -H 192.168.1.100 -U admin -P password sensor list
The output will show you each sensor's name, its current reading, and its status (e.g., "ok"). This is how you can quickly check if a server is overheating or if a fan has failed.
Let's watch a video demonstration of these commands in action.
What is BMC - Baseboard Management Controller
The 'Professor Linux' video also includes a practical command-line demo that reinforces what we've just discussed.
Watch the segment from 01:54 to 04:40. The presenter demonstrates: ipmitool sel list to view the System Event Log. How the log updates when a hardware state changes (he unplugs a PSU). ipmitool sensor to view live sensor data.
4. The Graphical Approach: Dell iDRAC
While ipmitool is excellent for automation and quick checks, vendor-specific web interfaces like Dell's iDRAC provide a rich, graphical view of the server's health.
Let's take a tour of the iDRAC interface. As you watch, notice how it presents the same information from the SEL and sensors, but in a more visual and consolidated format.
Dell iDRAC 9.0 Enterprise Features Overview with PowerEdge R750 | IT Creations
This video from IT Creations offers a comprehensive overview of the Dell iDRAC 9 interface. It's a perfect way to see how a modern graphical remote management tool works.
Watch the following segments to see how to monitor hardware health and logs: Dashboard and Logs (04:12 - 05:15): See the main dashboard for an at-a-glance health status and where to find the 'Recent Logs'. System Health Details (05:15 - 07:42): Pay attention to the 'System' tab, where you can drill down into the health of specific components like Cooling (fans, temperatures), CPU, Memory, and Power supplies. Storage Health (07:42 - 09:38): Look at the 'Storage' tab. This is where you would monitor the health of the hard drives and the status of the RAID arrays we discussed in a previous lesson.
The iDRAC interface makes it easy to visualize the server's state. You can see which fan is failing, which DIMM slot has an error, or the exact temperature of a CPU core, all from your web browser.
Conclusion
Today, you've learned how to bridge the physical and remote aspects of server management. This out-of-band access is a non-negotiable skill for any data center role.
Key Takeaways:
- The Baseboard Management Controller (BMC) is an independent computer-on-a-chip that enables out-of-band management.
- IPMI is the open standard, while iDRAC (Dell) and iLO (HPE) are popular, feature-rich vendor implementations.
- You can access the BMC through the command line using
ipmitoolto check logs (sel list) and hardware status (sensor list). This is ideal for scripting and automation. - You can also use a graphical web interface (like iDRAC) to get a detailed, visual overview of system health, logs, and component status.
- This remote access works even if the server is powered off or the OS is unresponsive, making it an essential tool for troubleshooting.
In our next lesson, we will continue exploring these powerful remote management interfaces. Now that you know how to monitor the server, you'll learn how to control it: we'll cover how to perform power control, launch a remote console (KVM), and mount virtual media to install an operating system, all from the comfort of your chair.