Hello! Welcome to the final lesson in our module on Network Troubleshooting and Security.
In our last session, we walked through the critical process of upgrading a network device's firmware. A key part of that process was post-upgrade verification—ensuring the device is not only online but also healthy. Today, we'll dive deep into the primary tool used for this kind of health monitoring: the Simple Network Management Protocol, or SNMP.
This lesson directly addresses your goals of diagnosing hardware issues and maintaining data center infrastructure. Being able to monitor network traffic and spot developing problems is a core skill for any network or systems administrator. Our learning outcome is to use SNMP to monitor interface utilization and interpret error counters on a network device. We'll explore the "why" behind the protocol and then put it into practice, so you can confidently explain how you monitor network health in a job interview.
1. What is SNMP and How Does it Work?
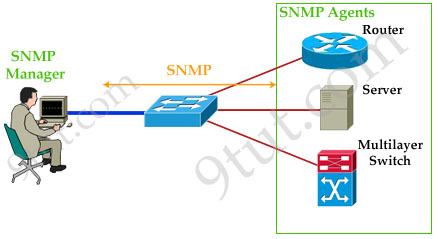
SNMP is the industry-standard protocol that allows a central management station to query and manage network devices like routers, switches, servers, and even printers. Instead of logging into each device individually to run show commands, you can use SNMP to gather performance data from your entire network automatically.
The basic architecture consists of a few key components:
- SNMP Manager: A server running a Network Management System (NMS) that polls devices for information.
- SNMP Agent: Software running on the managed device (e.g., your switch or router) that responds to the manager's queries.
- Management Information Base (MIB): A structured database on the agent that stores all the monitorable information. Think of it as a highly organized collection of all the stats you might see in a
show interfacescommand, and much more. - Object Identifier (OID): A unique, hierarchical address for a specific piece of data within the MIB. For example, there's a specific OID for the number of bytes received on an interface.
To get a solid grasp of these core concepts, let's watch a video from Professor Messer.
SNMP - CompTIA Network+ N10-009 - 3.2
This video, 'SNMP - CompTIA Network+ N10-009 - 3.2', provides a clear and concise explanation of SNMP's purpose, its core components, and its different versions.
Watch from the beginning to 04:36. Focus on these key points: The problem SNMP solves (00:00 - 01:02): Centralized monitoring. The role of MIBs and OIDs (01:02 - 01:28): The database and the address for data points. SNMP Versions (v1, v2c, v3) (01:28 - 02:44): Pay close attention to the security differences. SNMPv3 is the modern standard because it encrypts data. The structure of an OID (02:44 - 04:36): Understand that it's a numeric path to a specific variable.
A final key concept is the SNMP trap. While the manager typically polls agents for data, an agent can be configured to proactively send an alert, or "trap," to the manager if a critical event occurs (like an interface going down or an error threshold being crossed). This allows for immediate notification of problems.
2. Monitoring Interface Utilization
One of the most common uses of SNMP is to monitor interface utilization—how much of a link's capacity is being used. This is essential for capacity planning and identifying network bottlenecks.
The "Why": 32-bit vs. 64-bit Counters
SNMP counters track the number of octets (bytes) and packets passing through an interface. The original standard used 32-bit counters. However, on modern high-speed networks, these counters can "wrap" (reset to zero) very quickly, leading to inaccurate data.
To understand why this is a problem and how it was solved, please read the following from a Cisco FAQ.
Consider SNMP Counters: Frequently Asked Questions - Cisco
The document 'Consider SNMP Counters: Frequently Asked Questions' from Cisco explains the critical need for 64-bit counters on modern networks.
Read the section titled 'When do 64-bit counters be used?'. It clearly illustrates how fast a 32-bit counter can wrap on a 1 Gbps interface (just 34 seconds!), making it unreliable for accurate polling.
Because of this wrapping issue, modern network monitoring exclusively uses 64-bit counters, also known as High Capacity (HC) counters. The key OIDs for utilization are:
ifHCInOctets: Total octets received.ifHCOutOctets: Total octets transmitted.
These require SNMPv2c or SNMPv3 to query.
The "How": Calculating Utilization
An NMS calculates utilization by taking two samples over time. The formula looks like this:
Utilization % = ( (delta_octets) * 8 * 100 ) / ( (delta_time_in_seconds) * interface_speed_in_bps )
Let's break this down:
delta_octets: The NMS pollsifHCOutOctetsand gets a value. A few minutes later, it polls again. The delta is the difference between the two values.* 8: This converts the value from octets (bytes) to bits.* 100: To express the final result as a percentage.delta_time_in_seconds: The time between the two polls.interface_speed_in_bps: The configured speed of the interface (e.g., 1,000,000,000 for a 1 Gbps link), which the NMS gets from another OID calledifSpeedorifHighSpeed.
For a more detailed look at this standard calculation, you can review the following resource.
Understanding default SNMP utilization calculations
This New Relic documentation, 'Understanding default SNMP utilization calculations', provides a perfect, real-world example of the utilization formula.
Read the first section, focusing on the formula for IfInUtilization / IfOutUtilization. Note the 'Tip' at the end: inaccurate utilization reporting is often caused by a misconfigured interface speed on the device itself.
3. Interpreting Interface Error Counters
While high utilization can indicate a performance bottleneck, a rising error counter almost always points to a network fault. Being able to interpret these counters is a vital troubleshooting skill.
From the command line, you are used to seeing errors in the show interfaces output. SNMP provides OIDs that map directly to these counters.
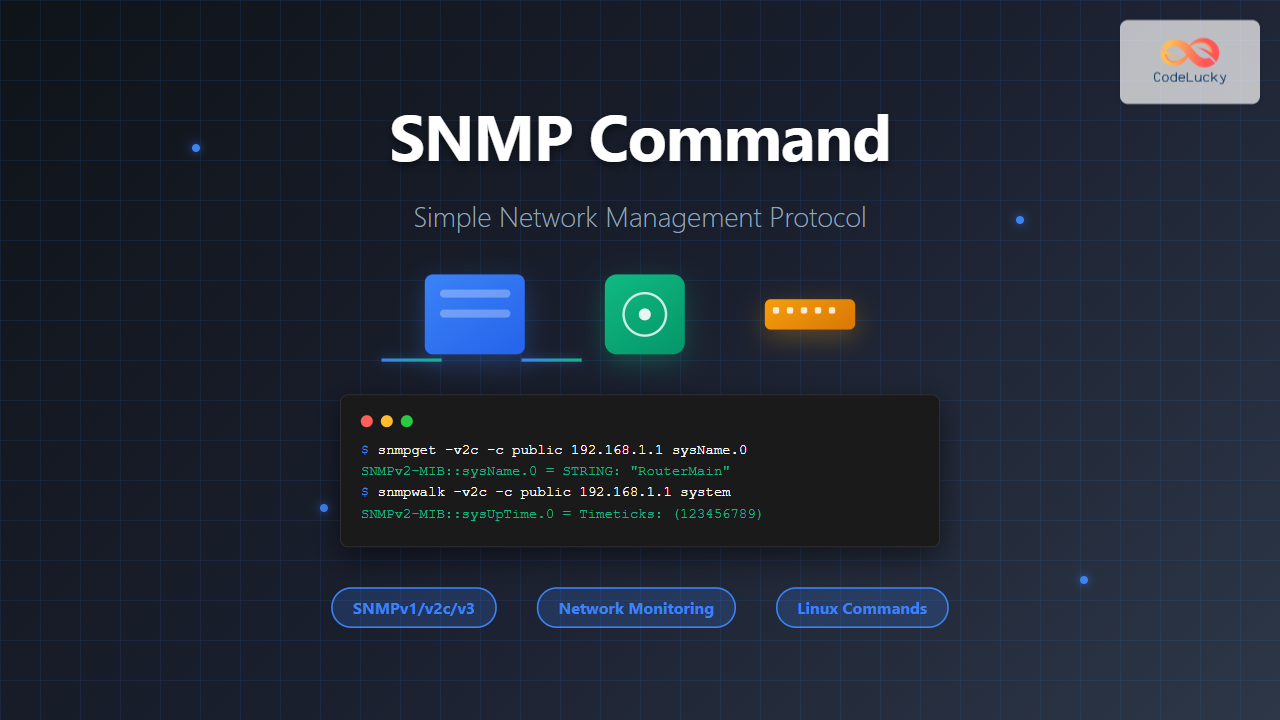
The most important error counters are:
| MIB Variable (OID) | show interfaces Equivalent |
What it Means |
|---|---|---|
ifInErrors |
input errors (sum of CRC, frame, overrun, etc.) |
A generic counter for received packets that had errors. An increase often points to a Layer 1 issue like a bad cable, faulty SFP, or duplex mismatch. |
ifOutErrors |
output errors |
A generic counter for packets that the device was unable to transmit successfully. |
ifInDiscards |
no buffer (a component of input queue drops) |
The number of inbound packets that were dropped because the device had no memory/buffer space to receive them. This points to a device being overwhelmed by a burst of traffic. |
ifOutDiscards |
output queue drops |
The number of outbound packets that were dropped because the output queue for that interface was full. This is a classic sign of a network bottleneck; the link cannot send data as fast as it's arriving. |
To see how these MIB variables correspond to CLI output and to understand the finer points, the Cisco FAQ is an excellent reference.
Consider SNMP Counters: Frequently Asked Questions - Cisco
Let's return to the Cisco FAQ to see a detailed breakdown of error counters.
Read the sections 'SNMP Counters and show Command Equivalent Questions' and the question below it about the relationship between 'no buffers' and 'input queue drops'. Focus on the table that lists the MIB variables and what they count. The examples showing snmpwalk output compared to show interfaces output are particularly useful for connecting the concepts.
Just like utilization, a raw error count isn't as useful as an error rate. An NMS will typically calculate this as a percentage of total packets. For example:
Input Error % = (delta_ifInErrors / delta_ifHCInUcastPkts) * 100
If you see an interface with a 0.01% error rate, it might be acceptable. If it suddenly jumps to 2%, you know you have an active problem that needs investigation.
4. The Big Picture: Using an NMS
While it's crucial to understand the underlying OIDs and calculations, in a real-world job you'll use a Network Management System (NMS) like Checkmk, Zabbix, or SolarWinds. These tools handle the polling, calculations, and data visualization for you, presenting the information in easy-to-read graphs and dashboards.
Using SNMP to monitor network devices #CMKTutorial
To see how this all comes together in a real tool, this video from Checkmk demonstrates adding a switch and having the NMS automatically discover and monitor its interfaces.
Watch from 01:51 to 05:38. You don't need to memorize the Checkmk-specific steps. Instead, focus on how the tool abstracts away the complexity: The engineer provides the IP and SNMP credentials (the 'community string' for v2c). The NMS runs an SNMP scan and automatically discovers the services to monitor, including every active interface (UP). For each interface, it automatically starts tracking key metrics like transfer speed, failure rate, and uptime, all derived from SNMP OIDs we've discussed.
Conclusion
You've now learned how to use the industry-standard protocol for monitoring the health of network devices. You understand not just how to check for utilization and errors, but why the underlying calculations work the way they do. This knowledge is fundamental to proactively managing a stable and performant network.
Key Takeaways:
- SNMP Architecture: Consists of a Manager (NMS), Agents (devices), MIBs (databases), and OIDs (data addresses).
- Utilization Monitoring: Best practice is to use 64-bit High Capacity (HC) counters (
ifHCInOctets,ifHCOutOctets) to avoid counter wrapping on fast links. Utilization is a rate calculated over time. - Error Interpretation: Key counters like
ifInErrors,ifOutErrors,ifInDiscards, andifOutDiscardsmap directly toshow interfacesoutput and point to specific types of faults (e.g., physical layer issues vs. congestion). - NMS is Key: In practice, an NMS automates the process of polling OIDs, calculating metrics, and visualizing data, allowing you to monitor hundreds or thousands of devices efficiently.
This lesson concludes our module on Network Troubleshooting and Security. You've built a powerful set of skills, from diagnosing connectivity with ping and traceroute to managing device configurations and now monitoring their ongoing performance.
In our next module, Data Center Operations and Deployment, we'll zoom out from individual devices. We'll start by looking at the physical environment they live in, and our first lesson will be to identify the roles of power, cooling, and structured cabling in a data center environment.