Hello! In our last lesson, we looked at the "big picture" of model assessment using goodness-of-fit tests like the deviance GOF test and the Hosmer-Lemeshow test. These tests give us a single verdict on whether the model, as a whole, is a reasonable fit for the data.
However, a passing grade on a GOF test doesn't mean our model is perfect. It might fit the data well on average, while still making very poor predictions for certain individual data points or systematically failing in subtle ways.
In this lesson, we will zoom in from this "macro" view to a "micro" view. We'll explore residual diagnostics, a set of tools for examining how well the model fits each individual observation. This will allow us to check for two critical issues:
- Model Misspecification: Are we using the right link function? Is our assumption about the variance correct? Have we missed an important predictor or used the wrong functional form for one?
- Influential Points: Are there one or two unusual data points that are having an outsized effect on our model's conclusions?
By the end of this lesson, you will be able to use various types of residuals and influence measures to diagnose these problems, ensuring your final model is not just statistically significant, but also robust and reliable.
Residuals in GLMs: More Than Just "Observed - Predicted"
In ordinary linear regression, a residual is simply the difference between the observed value () and the predicted value (). In the GLM world, it's a bit more complex. Because our response variable isn't assumed to have constant variance (e.g., in Poisson or Binomial models), we need more sophisticated ways to measure the error for each point.
We will focus on two main types of residuals for GLMs: Pearson residuals and deviance residuals.
Let's start with deviance residuals, as they connect directly to our last lesson. Remember that the total residual deviance measured the overall lack of fit. A deviance residual is simply the contribution of a single data point to that total.
To build a strong intuition, let's watch this short segment from StatQuest with Josh Starmer. It explains what deviance residuals represent and how they are used.
Please watch from 02:33 to 05:57. Focus on these key ideas: A deviance residual is the square root of a single data point's contribution to the total residual deviance. Just like residuals in linear regression, they can be plotted to identify points that the model fits poorly (outliers).
While deviance residuals are excellent for spotting general patterns of misfit, Pearson residuals are defined slightly differently. They are scaled by the estimated standard deviation of the response variable at each point. This makes them particularly useful for checking if our assumption about the variance function is correct.
In practice, we often use standardized versions of these residuals. Standardization adjusts the residuals to have a more constant variance and accounts for leverage (which we'll define shortly), making it easier to spot outliers.
For a formal definition of these different residual types, please review the following text.
Diagnosing Problems in Linear and Generalized Linear Models
This reading from 'Diagnosing Problems in Linear and Generalized Linear Models' provides clear definitions for the various types of residuals used in GLMs. Understanding this vocabulary is key to interpreting diagnostic plots correctly.
Please read Section 6.6.1, 'Residuals and Residual Plots' (pages 317-319). Pay close attention to the bulleted list that defines: Response residuals Pearson residuals Deviance residuals Standardized Pearson and Deviance residuals Approximate Studentized residuals \nYou don't need to memorize the formulas, but understand the conceptual difference between them.
Using Residual Plots to Diagnose Model Misspecification
Once we have our residuals, we can create diagnostic plots to look for signs of trouble. The goal in all these plots is to see a random, patternless cloud of points scattered around zero. Any systematic pattern is a red flag.

Here are the most important plots and what they help us diagnose:
-
Residuals vs. Fitted Values (or Linear Predictor):
- What it checks: The correctness of the systematic part of the model (link function) and the variance function.
- What to look for:
- Curvature: A U-shape or S-shape suggests you may have chosen the wrong link function or missed a quadratic term for a predictor.
- A "funnel" shape: If the spread of residuals increases or decreases as the fitted value changes, your variance function is likely incorrect (e.g., you assumed Poisson variance when the data is overdispersed).
-
Residuals vs. Explanatory Variables:
- What it checks: Whether the relationship with a specific predictor is modeled correctly.
- What to look for: Curvature in a plot of residuals against a predictor
xindicates that the functional form ofxis wrong. You might need to transform it (e.g., uselog(x)) or add a polynomial term (x^2).
-
Absolute Residuals vs. Fitted Values:
- What it checks: This plot is a more direct way to assess the variance function.
- What to look for: A trend in this plot indicates the variance is not behaving as your model assumes. A positive trend suggests the variance grows faster than you modeled.
The following reading provides a great summary of these and other useful diagnostic plots.
Introduction to Generalized Linear Models - Model checking
This PDF from a statistics course provides a concise catalogue of different diagnostic plots and how to interpret them.
Please read Sections 1 through 4 on pages 6-8, titled 'Informal checks using the residuals', 'Checking the variance function', 'Checking the link function', and 'Checking the scales of explanatory variables'. Focus on the purpose of each plot described.
A Modern Approach: The DHARMa Package
Manually creating and interpreting all these plots can be tedious. In R, the DHARMa package provides a fantastic, unified framework for GLM diagnostics by simulating new data from your fitted model and comparing it to your observed data.
How to interpret (and assess!) a GLM in R
This video provides a great practical demonstration of using the DHARMa package in R to check model assumptions. It shows how much easier this can make diagnostics.
Please watch from 10:04 to 11:50 and from 13:43 to 15:08. Notice how the package automatically produces diagnostic plots and runs formal tests for issues like non-constant variance (heteroscedasticity) and patterns in the residuals.
Identifying Outliers and Influential Points
The second major goal of diagnostics is to find individual points that are either poorly explained by the model or have a disproportionately large impact on it.
Three concepts are key here:
- Outlier: An observation with a response value () that is unusual given its predictor values (). These points will have large residuals. Studentized residuals are typically used to formally identify them.
- Leverage: An observation with an unusual combination of predictor values (). Such a point is far from the center of the predictor space and has the potential to be influential. Leverage is measured by hat-values ().
- Influence: The "damage" a single point does to your model. An influential observation is one that, if removed, would cause a substantial change in the estimated coefficients. Influence is a combination of being an outlier and having high leverage. The most common measure is Cook's Distance.
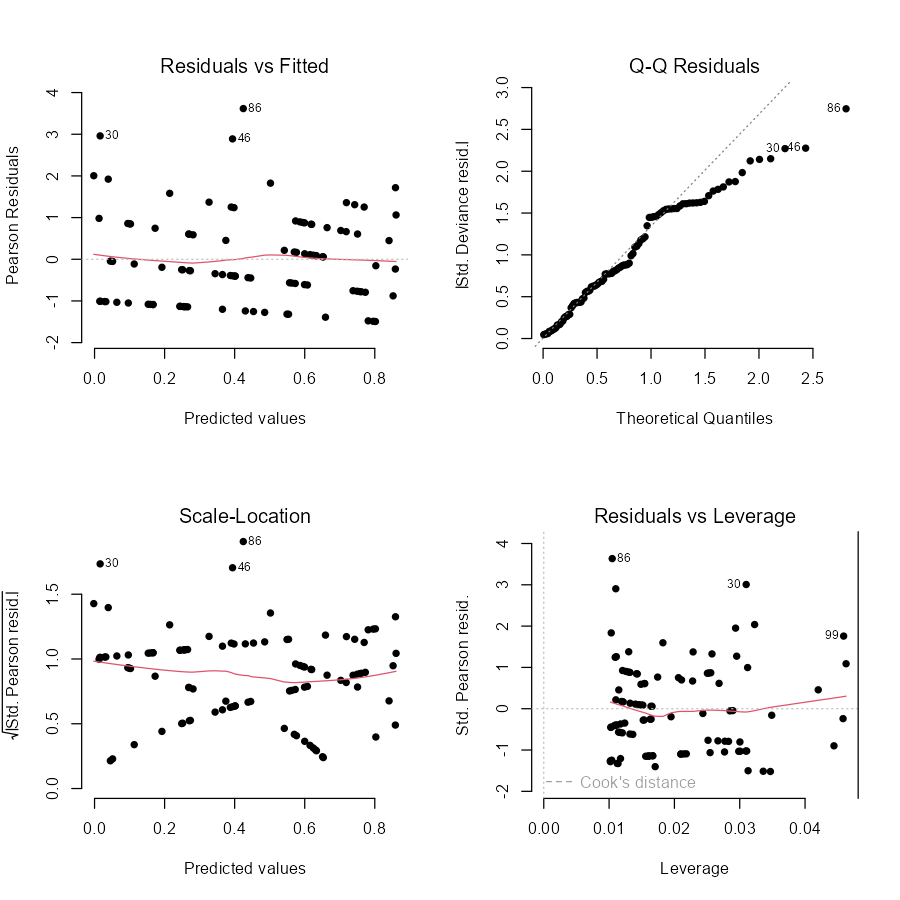
The workflow is to identify points with high leverage or high Cook's Distance and investigate them. Does the data point represent a data entry error? Or is it a genuinely unusual case that might warrant special attention or even removal from the dataset before finalizing the model?
Diagnosing Problems in Linear and Generalized Linear Models
This final reading explains how to measure leverage and influence, extending the concepts from linear models to GLMs.
Please read the following sections: Section 6.3.2 'Leverage: Hat-values' (p. 296-297): Understand what hat-values measure. Section 6.3.3 'Influence Measures' (p. 298-300): Focus on the definition and interpretation of Cook's Distance. Section 6.6.2 'Influence Measures' (p. 320-321): See how these concepts are applied in a GLM context. \nAgain, focus on the conceptual understanding: what does a high hat-value mean? What does a large Cook's distance tell you to do?
Conclusion
Model assessment is a two-step process. First, you check the overall goodness-of-fit to see if the model is plausible on a macro level. Then, you must perform residual diagnostics to ensure it's behaving well on a micro level.
Key Takeaways:
- Residuals in GLMs (like Pearson and deviance residuals) are more complex than in linear regression because they must account for non-constant variance.
- Plotting residuals against fitted values and predictors helps diagnose model misspecification, such as an incorrect link function or the need to transform a predictor. A patternless, random cloud of points is the ideal.
- Leverage (measured by hat-values) identifies points with unusual predictor values that have the potential to be influential.
- Influence (measured by Cook's Distance) identifies points that, if removed, would significantly change your model's coefficients. These are the most problematic points and require investigation.
Preview of the Next Lesson:
We have now completed our tour of the foundations of Generalized Linear Models! We've covered the core components, how to perform inference on coefficients, and how to assess model fit. In the next module, we will put all this theory into practice by focusing on the most famous GLM of all: Binary Logistic Regression. We'll learn how to formulate the model, interpret its coefficients in terms of odds ratios, and apply the diagnostic techniques you've learned here.