Introduction
Hello! In our last lesson, we concluded our look at tests for independent groups by learning how to apply and interpret trend tests like Cochran-Armitage and linear-by-linear association. A key theme throughout our course so far has been the assumption of independent observations—meaning each data point comes from a distinct, unrelated individual.
Today, we shift our focus to a different and very common type of data structure: paired data. This occurs in "before and after" scenarios, matched-pair studies, or when the same subject is measured under two different conditions. This lesson addresses a critical preliminary question: why can't we just use the familiar Pearson chi-square test on this type of data?
By the end of this lesson, you will be able to explain exactly why standard chi-square tests are inappropriate for paired or matched categorical data. This understanding is foundational for the next set of statistical tools we will learn.
1. The Crucial Assumption of Independence
Before we discuss paired data, let's revisit a core assumption of the Pearson chi-square test.
Chapter 12 Categorical data analysis | Learning statistics with R
The following reading discusses the assumptions of the chi-square test. We will focus specifically on the independence assumption, which is the most important concept for today's lesson.
Please read the short section '12.5 Assumptions of the test(s)', focusing on the second bullet point: 'Data are independent of one another'. The author uses a simple but effective example about observing babies in a hospital to illustrate what non-independent data looks like and why it's a problem.
As the reading highlights, the chi-square test of independence assumes that every single observation in your contingency table is independent of all others.
- What this means: When you survey 200 people about their smoking habits and political affiliation, the table has 200 independent entries. Person A's data has no bearing on Person B's data. Each person contributes to exactly one cell in the table.
- Why it matters: The entire statistical machinery of the test—the calculation of expected frequencies and the chi-square distribution itself—relies on this assumption. If observations are not independent, you effectively have less unique information than your sample size suggests. As the resource humorously puts it, non-independence "stuffs things up," leading to unreliable p-values.
2. Paired Data: A Different Structure
Now, let's look at a typical "paired" dataset. These designs are powerful but require special handling.
This document clearly defines matched pairs analysis and explains why standard tests don't apply. It provides an excellent contrast between a matched and a non-matched design.
Please read from the beginning of the document down to the end of the paragraph that starts with 'It is important to note...'. Pay close attention to the examples of matched pairs (pre-post, dyads) and the direct comparison between the table for depression over time (matched) and a table for party ID vs. candidate choice (not matched).
Let's break down the key idea from the reading with a visual example. Consider the table below, which tracks whether individuals experienced joint pain before and after a new treatment.
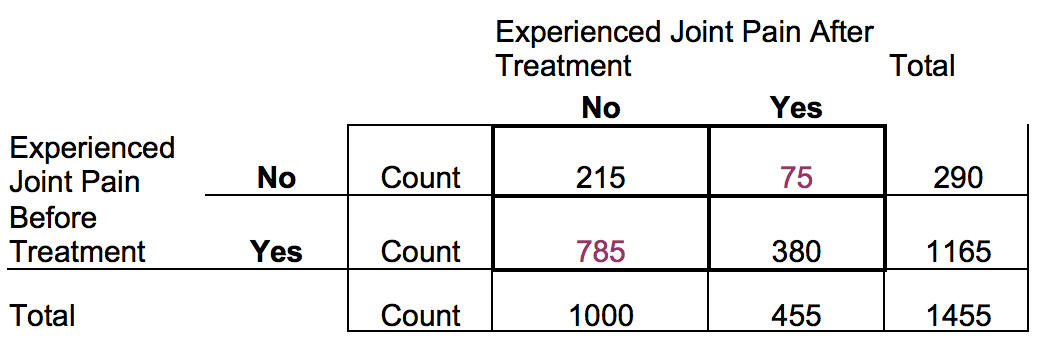
At first glance, this looks like any other 2x2 contingency table. But its structure is fundamentally different.
- In a standard chi-square test (independent data): You might have two separate groups of 1455 people each—one group that received a treatment and a control group that didn't. You would then compare the proportions of joint pain between these two independent groups.
- In this paired data table: We have only one group of 1455 people. Each person is measured twice. The person who said "Yes" to pain before treatment and "No" after treatment is the same person. Their "after" response is not independent of their "before" response; in fact, their potential correlation is the entire point of the study!
This is the core of the issue. A standard chi-square test of independence is designed to answer the question: "Are variable A and variable B independent?" In our example, that would be asking, "Is the status of joint pain before treatment independent of the status of joint pain after treatment?" This is the wrong question. We already know they are likely dependent because they are measurements from the same person.
The question we really want to ask is: "Did the proportion of people with joint pain change significantly after the treatment?"
3. The Violation Explained
Let's use a clear example from the first reading to solidify why the independence assumption is violated.
Chapter 12 Categorical data analysis | Learning statistics with R
This section provides a perfect illustration of the problem using a before-and-after political ad scenario. It explicitly states why a Pearson chi-square test is inappropriate.
Read the first two paragraphs of section '12.8 The McNemar test'. Focus on the explanation of why a sample of 100 people results in 200 non-independent observations and why this violates the assumption of the chi-square test.
As the text explains, with 100 participants measured before and after, we have 200 total data points (response_before and response_after). But we only have 100 independent subjects. A voter who intends to vote "Yes" before the ad is inherently more likely to vote "Yes" after the ad than someone who was a firm "No" to begin with. The two measurements from the same person are linked.
If you were to run a standard chi-square test on the joint pain data, you would be making a severe statistical error:
- You would be treating 1455 pairs of correlated measurements as if they were 1455 independent observations. This effectively misrepresents the amount of unique information in your data.
- The resulting test statistic and p-value would be meaningless. The test would be answering a nonsensical question about the "independence" of two measurements that are, by design, dependent.
Therefore, we must use a test that is specifically designed for this data structure—one that properly accounts for the paired nature of the observations.
Conclusion
Today, we've tackled a crucial conceptual point that separates analysis of independent groups from the analysis of related groups. You now have the functional understanding to recognize when a standard chi-square test is the wrong tool for the job.
Key Takeaways:
- The Pearson chi-square test of independence relies on the critical assumption that all observations are independent of one another.
- Paired data (or matched, or repeated-measures data) inherently violates this assumption because multiple measurements are taken from the same subject.
- An observation at Time 2 is not independent of the observation at Time 1 for the same person. They are correlated.
- Using a standard chi-square test on paired data answers the wrong question and produces an invalid result because its underlying assumptions are not met.
Preview of the Next Lesson:
Now that we have firmly established why the standard chi-square test is inappropriate, the natural next question is, "So what should we use instead?" In the next lesson, we will answer that by introducing the McNemar test, a simple but powerful tool designed specifically for analyzing changes in paired 2×2 tables.