Introduction
Hello! In our last lesson, we focused on the practical application of tests for independence, such as the Pearson chi-square test. A key aspect of that test is that it treats all categories as nominal—meaning it assumes the categories have no natural order. For instance, it analyzes "Mites" vs. "No Mites" without any sense that one is "more" or "less" than the other.
But what happens when our data does have a natural order? For example, what if we're comparing a new drug's effect across 'low', 'medium', and 'high' dosage groups? Shuffling the order of these categories would lose crucial information.
This lesson addresses exactly that situation. We will explore why specialized trend tests are often more appropriate and powerful than the general chi-square test when dealing with ordinal data. You will learn the logic behind this power advantage and the specific conditions under which a trend test is the superior tool.
1. The Limitation of the General Chi-Square Test
Let's start by revisiting the Pearson chi-square test. It tests for any kind of association between two categorical variables by comparing observed cell counts to the counts expected under the null hypothesis of independence.
The key limitation is that the chi-square statistic is "order-blind." If you have a table with ordinal categories (e.g., 'Mild', 'Moderate', 'Severe') and you were to reorder the rows or columns, the calculated value would remain exactly the same. The test is simply not designed to use the information contained in the ordering.
When you have ordinal data and a plausible reason to expect a directional relationship (e.g., higher income level is associated with higher education level), using a test that ignores this order is like trying to read a sentence by looking at the letters individually without considering their sequence. You might get some information, but you're missing the main story.
2. Introducing Trend Tests: Using the Order
A trend test is a specific type of hypothesis test designed to detect a monotonic association between variables. A monotonic association is one where, as the value of one variable increases, the value of the other variable tends to consistently increase (a positive trend) or consistently decrease (a negative trend).
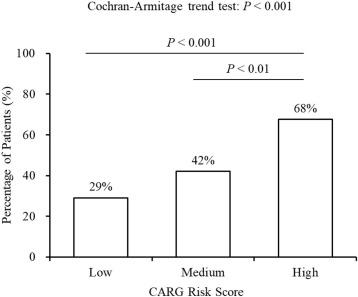
To achieve this, trend tests conceptually assign numerical scores to the ordered categories. For example, 'Low'=1, 'Medium'=2, 'High'=3. By doing this, the test transforms the problem from simply checking for "any difference" into checking for a "linear-like trend" between the scores of the two variables.
The following reading from The BMJ's "Statistics at Square One" series provides a concise explanation of the chi-square test for trend and highlights its main advantage.
8. The Chi squared tests - The BMJ
Please read the section 'χ² Test for trend'. This section will introduce you to the core concept and show a direct comparison with the overall chi-square test.
In the provided text, find and read the subsection titled 'χ² Test for trend'. Focus on the explanation of why this test can be more powerful and how its degrees of freedom differ from the general chi-square test.
3. The Source of Power: Specificity and Degrees of Freedom
As you just read, the primary reason a trend test is more powerful is that it tests a more specific alternative hypothesis. This difference is best understood by looking at the hypotheses and the corresponding degrees of freedom (df).
| Test Type | General Chi-Square Test | Trend Test |
|---|---|---|
| Alternative Hypothesis | There is any type of association between the variables. | There is a monotonic (linear) trend between the variables. |
| Degrees of Freedom (df) | , where I and J are the number of rows/columns. | 1 |
Think of degrees of freedom as the number of independent pieces of information used to describe the association.
- A general chi-square test with, for example, 4 df is using its statistical power to look for 4 different patterns of association at once. It's casting a wide net.
- A trend test always has just 1 df. It concentrates all of its statistical power on detecting one single pattern: a monotonic trend. It's using a spear instead of a net.
If the true relationship in your data is a trend, the focused approach of the trend test makes it much more likely to detect it and produce a smaller p-value, even if the overall chi-square test is not significant.
4. When Trend Tests Excel... and When They Fail
This focused power comes with a critical trade-off. A trend test is the right tool for the right job, but it performs poorly when the association is not monotonic.
When to Use a Trend Test:
- When at least one of your variables is ordinal.
- When you have a plausible, pre-existing hypothesis that the relationship is monotonic (e.g., a dose-response relationship, effect of aging, etc.).
When a Trend Test Fails:
A trend test will have very low power to detect a significant association if the pattern is non-monotonic, such as a U-shaped or inverted U-shaped relationship. In this situation, the general chi-square test is more powerful because its "wide net" approach is more likely to catch the complex pattern.
The next reading provides a fantastic discussion of this exact scenario.
4 Tests for Ordinal Data and Small Samples - Statistics Online
This reading from Penn State's online statistics course clearly explains the power advantage of a trend test and, crucially, provides an example where it fails.
Please read the subsection titled 'Power vs Pearson Test of Association'. Pay close attention to the two hypothetical tables comparing drug levels to success rates. Note how the trend test (MH test) performs in both the linear and non-linear scenarios compared to the Pearson test.
The example in the reading is the perfect illustration of this lesson's key functional concept:
- Scenario 1 (Linear Trend): Success rates increase with drug level (5 -> 10 -> 15). The trend test is more powerful and yields a smaller p-value than the general chi-square test.
- Scenario 2 (Non-linear Trend): Success rate peaks at the medium drug level (5 -> 10 -> 5). The trend test finds no evidence of a linear trend (), while the general chi-square test correctly detects that there is an association.
Choosing the right test requires you to think about the plausible nature of the relationship in your data before you run the analysis.
Conclusion
In this lesson, we established the fundamental "why" and "when" for using trend tests. You've learned that they are not a replacement for the general chi-square test, but a more specialized and powerful tool for a specific type of data and research question.
Key Takeaways:
- Purpose: Trend tests are used to detect monotonic (ordered) associations in data where at least one variable is ordinal.
- Power Advantage: By testing a more specific alternative hypothesis (linear trend vs. any association), a trend test concentrates its statistical power. This is reflected in it having only 1 degree of freedom, making it more likely to find a true trend than a general chi-square test.
- The Trade-Off: This power is specific to monotonic trends. Trend tests can completely miss significant non-monotonic associations (like a U-shaped pattern), where a general chi-square test would be more appropriate.
- Appropriate Use: The choice to use a trend test should be driven by the nature of your variables (ordinal) and your hypothesis (a plausible trend).
Preview of the Next Lesson:
Now that you understand when and why to use a trend test, our next step is to learn the specifics of how. In the next lesson, we will dive into the Cochran-Armitage trend test, a widely used method for analyzing tables with one ordinal variable and one nominal variable (e.g., dose level vs. treatment success/failure). We will cover its hypotheses, assumptions, and practical application.