Introduction
In our previous lesson on Fisher's exact test, we saw a powerful method for getting a p-value without relying on the approximations of the chi-square distribution. The key idea was to calculate the exact probability of our observed 2×2 table by considering all other possible tables with the same row and column totals.
This lesson generalizes that powerful idea. We will explore permutation tests, a broad and intuitive framework for hypothesis testing that Fisher's test is a specific example of. Permutation tests are incredibly useful in data science because they require fewer assumptions than traditional parametric tests and can be adapted to almost any situation.
By the end of this lesson, you will understand the core logic of a permutation test: what it means to test a hypothesis by "shuffling" your data, how this process generates a p-value, and why this approach is so flexible and powerful.
1. The Core Idea: Shuffling Under the Null Hypothesis
The entire logic of a permutation test rests on a single, elegant idea: If the null hypothesis is true, then the group labels on our data points are arbitrary.
Imagine an experiment testing a new drug versus a placebo. The null hypothesis (H₀) is that the drug has no effect. If this is true, then whether a person was in the "drug" group or the "placebo" group shouldn't be related to their outcome. The outcome would have been the same regardless of the group assignment. Therefore, we can shuffle these labels around, and the results we get should be just as plausible as the result we actually observed.
This shuffling process allows us to simulate thousands of possible outcomes that could have happened just by random chance if the null hypothesis were true.
To build your intuition for this process, let's walk through a simple, visual explanation.
The Permutation Test: A Visual Explanation
This article, 'The Permutation Test: A Visual Explanation', uses a fun analogy about alpaca wool to make the concept of permutation testing very clear and intuitive. It will guide you through the fundamental steps without any complex formulas.
Please read the article from the beginning down to the section titled 'More Permutations'. Focus on understanding these key steps: Hypothesis Setup: How the null and alternative hypotheses are defined. Test Statistic: The idea of using a single number (like the difference in means) to summarize the effect. The 'Permutation' Step: The core idea of shuffling the group labels ('shampoo' in this case) while keeping the outcomes ('wool quality') fixed.
The process you just read about can be summarized in three main steps, which form the backbone of any permutation test:
- Calculate an observed test statistic from your original data.
- Shuffle the labels of your data and recalculate the test statistic. Repeat this many times.
- Compare your observed statistic to the distribution of shuffled statistics to get a p-value.
2. A Step-by-Step Walkthrough
Now that you have the general idea, let's solidify it by walking through a detailed example. We will see exactly how the shuffling process creates a null distribution and how that leads to a p-value.
Permutation Hypothesis Testing with Example | Statistics Tutorial # 37 | MarinStatsLectures
The following video from MarinStatsLectures provides a clear, step-by-step walkthrough of a permutation test using a simple dataset. It meticulously explains each part of the process.
Watch the video from the beginning to 16:48. As you watch, focus on understanding: Why use a permutation test? The video starts by listing reasons like small sample sizes or violated assumptions (00:00 - 04:31). The Test Statistic: Note that they calculate two different statistics (difference in means and medians), highlighting the flexibility of this approach (04:31 - 07:00). The Logic of Permutation: Pay close attention to the explanation of why shuffling the data is valid under the null hypothesis (07:00 - 10:10). Building the Null Distribution: See how they generate new test statistics from the permuted datasets (10:10 - 14:12). Calculating the p-value: Understand how the observed statistic is compared to the distribution of permuted statistics to find the p-value (14:12 - 16:48).
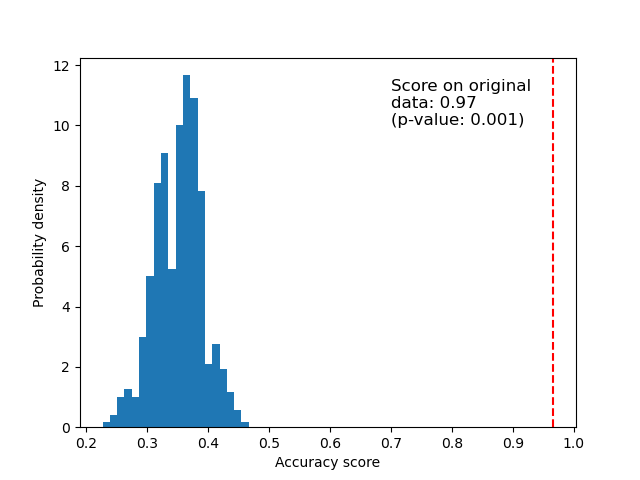
As the video explained, the thousands of test statistics you calculate from the shuffled datasets form an empirical null distribution. This distribution represents the range of results you'd expect to see if there were truly no effect.
The p-value is then simply the proportion of results from this null distribution that are as extreme or more extreme than the one you originally observed.
3. Applying Permutation Tests to Contingency Tables
So, how does this general framework apply to our main topic—contingency tables and the chi-square statistic?
Recall that the standard chi-square test compares the observed statistic to a theoretical chi-square distribution to get a p-value. This theoretical distribution is an approximation that works well for large samples. A permutation test gives us an alternative, exact way to get that p-value, which is especially useful when the assumptions of the chi-square test are violated.
Here’s how it works for a contingency table:
- Calculate the statistic from your original table. This is your observed statistic.
- Take the column that defines your groups (e.g., 'Treated' vs. 'Placebo') and randomly shuffle it.
- Create a new contingency table using this shuffled group column and the original outcome column.
- Calculate the statistic for this new, permuted table.
- Repeat steps 2-4 thousands of times to build a null distribution of statistics.
- The p-value is the proportion of permuted statistics that are greater than or equal to your original, observed statistic.
The following resource explains this specific application in detail.
Permutation tests for the X² statistic
This page from Stats LibreTexts, 'Permutation tests for the X² statistic', directly connects the general concept of permutation testing to the chi-square statistic we've been studying.
Read the section that begins with 'The chisq.test function reports a p-value by default. Before we discover how it got that result, we can rely on our permutation methods...'. This section explicitly describes how shuffling the grouping variable allows you to build a null distribution for the X² statistic.
This method is powerful because it frees us from relying on the chi-square distribution's assumptions about expected cell counts. We are generating our own custom null distribution directly from the data.
4. Functional Understanding: Strengths and Weaknesses
To know when permutation tests are important and when they might fail, let's summarize their key characteristics.
Strengths:
- Flexibility in Test Statistic: You are not limited to standard statistics. You can use the difference in means, medians, proportions, the 90th percentile, or any other metric that captures the effect you care about. This is a significant advantage in data science, where you might need to test unconventional hypotheses.
- Fewer Assumptions: Permutation tests do not assume that your data follows a particular theoretical distribution (e.g., a Normal distribution). This makes them a type of non-parametric test that is robust to outliers and skewed data.
- Intuitive Logic: The underlying concept of "what could have happened by chance" is often easier to understand and explain than the complex mathematics behind many parametric tests.
Weaknesses:
- Computationally Intensive: Generating thousands of permutations and recalculating statistics requires computing power. This is not a test you can perform by hand, but with modern computers, it is rarely a practical limitation.
- The Exchangeability Assumption: The test assumes that under the null hypothesis, the data points are exchangeable. This holds true in a randomized experiment but might be violated in more complex designs, such as with matched pairs or time-series data where observations are not independent.
- Primarily for Hypothesis Testing: While great for getting a p-value, generating confidence intervals from a permutation test is less straightforward than with parametric methods (though a related technique called bootstrapping is excellent for this).
The video from TileStats reinforces this idea of generality by showing how the same permutation logic can be applied to get p-values for a t-test (comparing two groups) and an ANOVA F-test (comparing three or more groups).
PERMANOVA and permutation tests - explained
This brief clip demonstrates how the permutation logic can be applied to different test statistics, highlighting its role as a general framework.
Watch from 02:40 to 07:31. Notice how they first use the t-statistic and then switch to the difference in means, getting the same p-value. They then extend the same logic to the F-statistic from an ANOVA. This illustrates the flexibility of the permutation approach.
Conclusion
In this lesson, you've learned about the powerful and flexible framework of permutation testing. It provides an intuitive, computer-driven method for hypothesis testing that relies on fewer assumptions than many traditional tests.
Key Takeaways:
- Core Concept: Permutation tests work by shuffling the group labels of your data under the assumption that these labels are arbitrary if the null hypothesis is true.
- The Process: By repeatedly shuffling and recalculating a chosen test statistic, you build an empirical null distribution that reflects the possible outcomes due to random chance alone.
- The P-value: The p-value is the proportion of outcomes in the null distribution that are at least as extreme as your originally observed result.
- Key Advantage: The method is distribution-free and allows for flexible choices of test statistics, making it a valuable tool for a data scientist.
Preview of the Next Lesson:
We have now covered the theory behind three essential tests for independence: the Pearson chi-square test, Fisher's exact test, and permutation-based tests. In our next lesson, we will move from theory to practice. You will learn how to apply these tests to real data, interpret the output from statistical software, and report your findings correctly.