Introduction
In our last lesson, we established the crucial assumptions behind the Pearson chi-square test. We learned that because it is an approximation, its accuracy breaks down when dealing with small sample sizes, specifically when the expected counts in your contingency table are too low. This begs the question: what should you use when the chi-square test is inappropriate?
This lesson answers that question by introducing Fisher's exact test. Unlike the chi-square test, Fisher's test calculates an exact probability, making it the gold standard for analyzing 2×2 contingency tables with small samples. By the end of this lesson, you will understand the logic behind how Fisher's test works and, most importantly, be able to identify exactly when you should prefer it over the chi-square test.
1. When to Prefer Fisher's Exact Test
The decision of whether to use a chi-square test or Fisher's exact test comes down to one key factor: the size of your expected cell counts.
As we covered previously, the chi-square test's p-value is based on an approximation that is only valid with a sufficiently large sample. The most common rule of thumb is that if more than 20% of your cells have an expected count of less than 5, the approximation is unreliable. For a 2×2 table, this means if any single cell has an expected count below 5, you should not use the chi-square test.
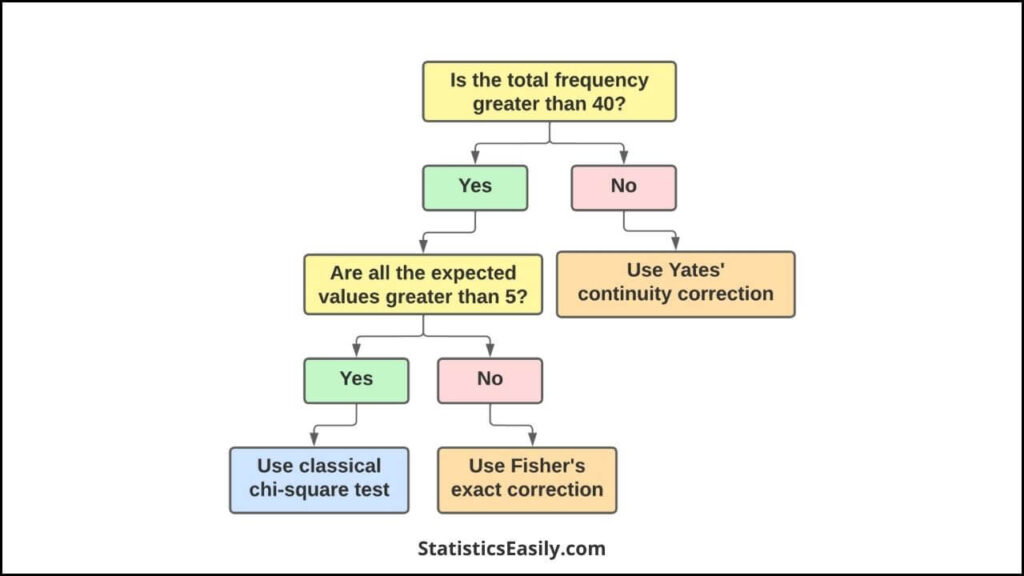
In these situations, Fisher's exact test becomes the preferred method. The flowchart below provides a simple decision-making guide.
To hear this explained, watch this very brief clip where the distinction is discussed.
MRCP Part 1: Fisher exact-test and the chi-square test
In this video from Pastest, the presenters directly address the difference between the chi-square test and Fisher's exact test, emphasizing the role of sample size.
Watch the section from 01:19 to 02:47. Note how they describe the chi-square test as an 'approximate test' that fails with small samples, and Fisher's as the 'exact' and 'best test' in those scenarios.
Let's look at a concrete example of a dataset where this choice becomes critical.
Chi-square and Fisher's exact tests
The following article from the Cleveland Clinic Journal of Medicine provides a medical research example. The authors first analyze a table where chi-square is appropriate, and then present a second table where its assumptions are violated, necessitating an alternative like Fisher's test.
First, quickly review the section titled 'To obtain the actual P value...'. Notice that the assumptions for the chi-square test are met (minimum expected count was 10.9). Then, read the next section (starting with the header 'FIGURE 3') carefully. Pay attention to how they calculate the expected counts for a new table and conclude that the chi-square test 'may not be an appropriate choice' because two of the four expected counts are less than 5.
In summary, the rule is clear: if you are analyzing a 2×2 contingency table and any expected cell count is less than 5, you should use Fisher's exact test.
2. The Logic Behind an "Exact" Test
So, how does Fisher's test manage to work without relying on large-sample approximations? It does so by calculating the exact probability of observing your specific data, assuming the null hypothesis (of no association) is true.
The logic works like this:
- Fix the Margins: The test imagines that the row and column totals (the marginals) of your contingency table are fixed. For instance, in a study with 10 smokers and 15 non-smokers, and 8 people with cancer and 17 without, these totals are taken as given.
- Enumerate All Possibilities: With those margins fixed, the test calculates all possible 2×2 tables that could have been formed.
- Calculate Probabilities: Using the hypergeometric distribution, the test calculates the exact probability of each one of these possible tables occurring purely by chance.
- Sum the Probabilities: The p-value is the sum of the probabilities of all tables that are as extreme or more extreme than the one you actually observed.
This video provides an excellent intuitive explanation of this process, starting with a simple ball-drawing analogy.
Fisher's test and how to calculate the exact p-value
This video from TileStats masterfully breaks down the logic of Fisher's exact test. It starts with an analogy to help you understand the hypergeometric probability calculation before applying it to a contingency table.
Watch the video from 02:10 to 13:00. Don't worry about memorizing the formulas. Focus on understanding the core ideas: How the ball-drawing example relates to calculating the probability of a specific table (02:10 - 07:31). How the p-value is found by summing the probabilities of your observed table and all 'more extreme' tables (07:31 - 13:00).
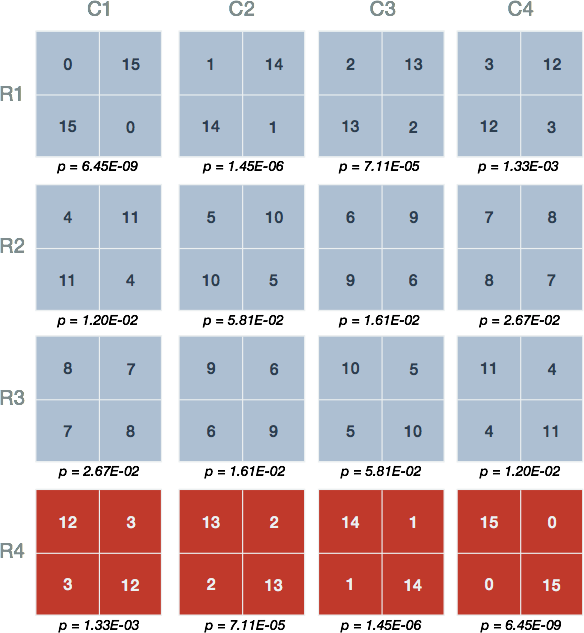
The core idea is that we are directly calculating the probability of our outcome from all possible outcomes, given our fixed totals. The image below shows what this looks like conceptually. Each table has the same marginal totals, but the internal cell counts differ, leading to a different probability for each configuration.
To see this process again with a different worked example, let's return to the article from the Cleveland Clinic Journal of Medicine.
Chi-square and Fisher's exact tests
This reading walks through the exact steps described in the video: enumerating all possible tables with fixed marginals, calculating the probability of each, and summing the probabilities of the observed table and all more extreme tables.
Read the section titled 'Instead of using methodology that is an approximation...'. Follow the step-by-step process of how the p-value is calculated. Notice how they identify the observed table, calculate its probability, find all tables that are 'more extreme' (i.e., have a lower probability), and then sum these probabilities together to get the final p-value.
3. Strengths and Limitations
You now know when to use Fisher's test and the logic behind it. To complete your functional understanding, it's important to know its limitations.
Strengths:
- Exactness: It provides an exact p-value, not an approximation. This makes it highly reliable, especially for small or sparse datasets.
- No Minimum Sample Size: It works perfectly even with very small cell counts.
Limitations:
- Conservatism: Fisher's test can sometimes be "conservative," meaning it might have lower statistical power than an alternative test. A conservative test is less likely to yield a significant p-value, so you could be at a slightly higher risk of a Type II error (failing to detect a real association).
- Computationally Intensive: The process of enumerating all possible tables becomes computationally very demanding for tables larger than 2×2. While extensions exist (e.g., the Freeman-Halton extension), for a large r × c table, the chi-square test is far more practical, assuming its assumptions are met.
The following resource provides a concise summary of these trade-offs.
Fisher's Exact Test: Making Decisions with Small Samples - DataCamp
This article from DataCamp provides a clear comparison of different statistical methods for contingency tables and discusses the limitations of Fisher's test.
Read the section 'Comparison with Alternative Statistical Methods' and focus on the table comparing different tests. Then read the section 'Limitations and Methodological Considerations' to understand the issues of conservatism and computational cost.
Conclusion
In this lesson, we added a crucial tool to your data analysis toolkit. You learned how to handle situations where the popular chi-square test is not valid.
Key Takeaways:
- When to Use: Prefer Fisher's exact test over the chi-square test for a 2×2 table whenever any expected cell count is less than 5.
- The Logic: It works by calculating an exact p-value based on the hypergeometric distribution. It considers all possible tables with the same marginal totals as your observed data and sums the probabilities of the tables that are as extreme or more extreme than yours.
- Key Properties: Fisher's test is the "gold standard" for small samples because it is exact, but it can be computationally intensive for larger tables and is sometimes considered statistically conservative.
Preview of the Next Lesson:
The method used by Fisher's test—enumerating all possible arrangements of the data to calculate an exact p-value—is an example of a broader and very powerful class of methods known as permutation tests. In the next lesson, we will explore the general concept of a permutation test, which can be applied to many different types of hypothesis testing beyond contingency tables.