Introduction
In our previous lesson, we learned how to construct the Pearson chi-square () statistic and determine its degrees of freedom. This gave us a powerful tool to measure the discrepancy between our observed data and what we would expect if there were no association between our variables.
However, like any statistical test, the chi-square test isn't universally applicable. Its results are only reliable if certain underlying assumptions are met. This lesson focuses on those "rules of the road." You will learn to identify the key assumptions of the chi-square test, with a special emphasis on the most common reason for its misuse: small expected cell counts. Understanding this will equip you to know not just how to run the test, but, more importantly, when it is appropriate to do so.
1. The Core Assumptions of the Chi-Square Test
A statistical test's validity hinges on its assumptions. For the chi-square test of independence, these assumptions ensure that the calculated statistic properly follows the theoretical chi-square distribution, which is what allows us to get an accurate p-value.
For a quick overview of these assumptions, please watch the following short video.
What Are The Assumptions for the Chi-Square Test of Independence? |Statistics
This video from Learn2Stats provides a concise summary of the main assumptions for the chi-square test of independence.
Watch the entire video (00:00 - 01:53). Pay attention to the three main categories of assumptions: the type of data, the independence of observations, and the expected cell counts.
To formalize and expand on what you just saw, here are the key assumptions, which are also detailed in the research paper we will look at next.
-
Data as Frequencies: The test must be performed on raw counts or frequencies, not on percentages, proportions, or other transformed data. Using percentages artificially changes the sample size to 100, which will produce an incorrect value and an unreliable p-value.
-
Mutually Exclusive and Exhaustive Categories: Each observation must fit into one, and only one, category for each variable. For example, if a variable is "Highest Education Level," the categories ("High School," "Bachelor's," "Master's") must be defined so that no person can fit into more than one.
-
Independence of Observations: Each subject or item in your dataset should contribute to only one cell in the contingency table. This means the test is not suitable for repeated measures or paired data (e.g., measuring the same group of people before and after an intervention). We will cover specific tests for paired data, like the McNemar test, later in the course.
-
The Expected Count Assumption: This is the most critical and frequently violated assumption. The chi-square test is an approximation, and this approximation is only accurate when the sample size is large enough. The common rule of thumb is:
- At least 80% of the cells must have an expected count of 5 or more.
- No cell should have an expected count of less than 1.
The following reading from the Journal of the American Association for Medical Technologists provides a clear, formal list of these assumptions.
The Chi-square test of independence - PMC - NIH
For a more detailed and formal description of these assumptions, please read the relevant section of this article from the NIH's PubMed Central.
Read the section titled 'Assumptions of the Chi-square'. This section lists six points that formalize the assumptions we've just discussed, including the crucial rule for expected cell counts (point #6).
2. Why Small Expected Counts Are a Problem
You might be wondering why the expected counts matter so much. The reason is mathematical but the concept is intuitive.
The p-value from a chi-square test comes from comparing our calculated statistic to the theoretical chi-square distribution (the smooth curves you saw in the last lesson). This theoretical distribution is a continuous curve, but the set of all possible outcomes from our contingency table is discrete (you can have 4 observations in a cell, or 5, but not 4.5).
- When the sample size is large, the discrete distribution of possible test statistics is very well-approximated by the smooth chi-square curve. The p-value is accurate.
- When the sample size is small, leading to small expected counts, the discrete distribution is "blocky" and does not resemble the smooth curve. Using the smooth curve to calculate the p-value can be highly inaccurate.
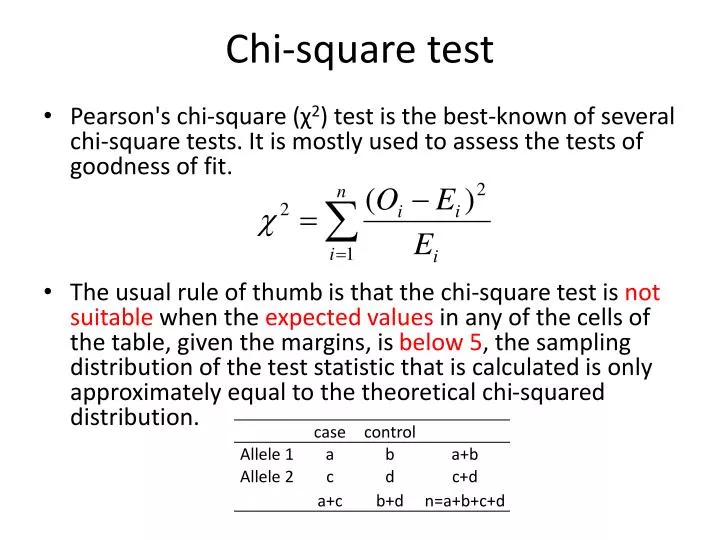
The next reading explains this distinction clearly. It sets up the context for why an "exact" test is sometimes needed, which is a topic we'll cover in the next lesson.
Fisher's Exact Test: Using & Interpreting
This article from Statistics by Jim directly addresses why the chi-square test can be invalid with small samples and contrasts it with its alternative, Fisher's exact test.
Read the section 'When to Use Fishers Exact Test vs Chi Square'. Focus on the explanation for why chi-square p-values become invalid with small cell counts and note the guidelines provided for when to use an alternative test.
3. How to Check for Violations
Fortunately, checking the expected count assumption is straightforward. Any good statistical software will calculate the expected counts for you as part of the chi-square test procedure. You simply need to examine the output.
Let's look at a typical output from a statistical package.

To check for violations, you follow these steps:
- Run the chi-square test using your software.
- Make sure the output includes the expected counts for each cell.
- Examine the expected counts and apply the rule:
- Are there any cells with an expected count less than 1?
- What percentage of cells have an expected count less than 5? If it's more than 20%, the assumption is violated.
- Look for a footnote, like the one in the image above, which often summarizes this for you.
4. Consequences of Violating the Assumptions
What happens if you ignore the assumptions and use the test anyway? Your results become unreliable. The p-value you obtain might be wrong, leading you to an incorrect conclusion. As the article "The Chi-square test of independence" explains, this can result in two types of critical errors:
- Type I Error (False Positive): Your test might yield a significant p-value (e.g., p < 0.05) when no real association exists. You might claim a relationship exists when it was just due to chance and the test's inaccuracy.
- Type II Error (False Negative): Your test might yield a non-significant p-value when a real association does exist. You might miss a genuine finding because the test lacked the power to detect it under the violated conditions.
In short, violating the assumptions means you can no longer trust your p-value or the conclusion you draw from it.
Conclusion
In this lesson, we established the essential "rules of the road" for using the chi-square test of independence. You learned that this test, while powerful, is an approximation that depends on several key assumptions to be valid.
Key Takeaways:
- The chi-square test requires data to be raw counts from independent observations sorted into mutually exclusive categories.
- The most critical assumption is that the expected counts in the cells are not too small. The standard rule is that no cell should have an expected count below 1, and at least 80% of cells should have an expected count of 5 or more.
- This assumption exists because the chi-square statistic only approximates the theoretical chi-square distribution, and this approximation fails with small samples.
- Violating this assumption can lead to an unreliable p-value, potentially causing a Type I or Type II error.
- You can and should always check this assumption by examining the expected counts provided by your statistical software.
Preview of the Next Lesson:
Now that you can identify when the chi-square test is inappropriate due to small sample sizes, the natural question is: "What should I use instead?" In the next lesson, we will answer that question by introducing Fisher's exact test, a method specifically designed for situations where the chi-square test's assumptions are not met.