Hello! Welcome back to our course on Categorical Data Analysis.
In our last lesson, we established the conceptual foundation of multinomial logistic regression. We learned that it's designed for nominal outcomes with more than two categories and that it works by creating K-1 logit models, each comparing a category to a chosen reference category.
Today, we will move from theory to practice. Our goal is to fit a multinomial logistic regression model to a dataset and, most importantly, learn how to interpret the full set of coefficients it produces. This will give you a complete picture of how predictors influence the choice between multiple outcomes.
1. The Core Idea: One Model, Multiple Equations
As a quick refresher, remember that a multinomial model doesn't produce just one set of coefficients. If your outcome has K categories, you'll get K-1 sets of coefficients. Each set belongs to an equation that models the log-odds of being in one specific category versus the reference category.
Let's watch a short video that uses a concrete example to show how these equations are structured and how to interpret the resulting coefficients.
Multinominal logistic regression, Part 1: Introduction
The video 'Multinominal logistic regression, Part 1: Introduction' from NCRM provides a clear, practical example of interpreting coefficients for a three-category outcome.
Please watch from 07:34 to 13:50. Pay close attention to how the output is presented in two parts (one for each non-reference category) and how the presenter interprets the coefficients first on the log-odds scale and then as more intuitive odds ratios.
As the video demonstrated, the interpretation always involves three parts: the predictor, the outcome category, and the reference category. For instance, "the odds of being unemployed versus in employment are 42% lower for women than for men."
2. A Practical Example: Choosing a High School Program
Let's ground our learning in a new, slightly more complex example. We'll use a dataset containing information on 200 students. Our goal is to model their choice of academic program.
- Dependent Variable (Y):
prog- Program type, with three categories:generalacademicvocational
- Predictor Variables (X):
ses- Social economic status (a categorical variable: "low", "middle", "high")math- Standardized math score (a continuous variable)science- Standardized science score (a continuous variable)
Since the program choice is a nominal variable with three categories, multinomial logistic regression is the perfect tool.
3. Fitting and Interpreting the Model
For this analysis, we will set 'academic' as the reference category. This is a common choice as it is the largest group in the dataset. Therefore, our model will produce two sets of coefficients:
- One for comparing
generalvs.academic. - One for comparing
vocationalvs.academic.
The resource below walks through the process of fitting this model in R and provides the output tables we will analyze.
Chapter 11 Multinomial Logistic Regression | Companion to BER 642
This chapter from 'Companion to BER 642' provides a full R lab for our example. We will focus on the setup and the interpretation of the results.
Please read through the sections 'Run the Multinomial Model using “nnet” package' (11.7.3), the short part on logit coefficients at the end of that section, and 'Parameter Estimates' (11.7.8). You don't need to run the code, but pay attention to how the reference category is set and how the output is structured. We will deconstruct the interpretation provided.
Deconstructing the Output
After running the model, the software provides a table of coefficients. It typically looks something like this, with one row for each non-reference category comparison:
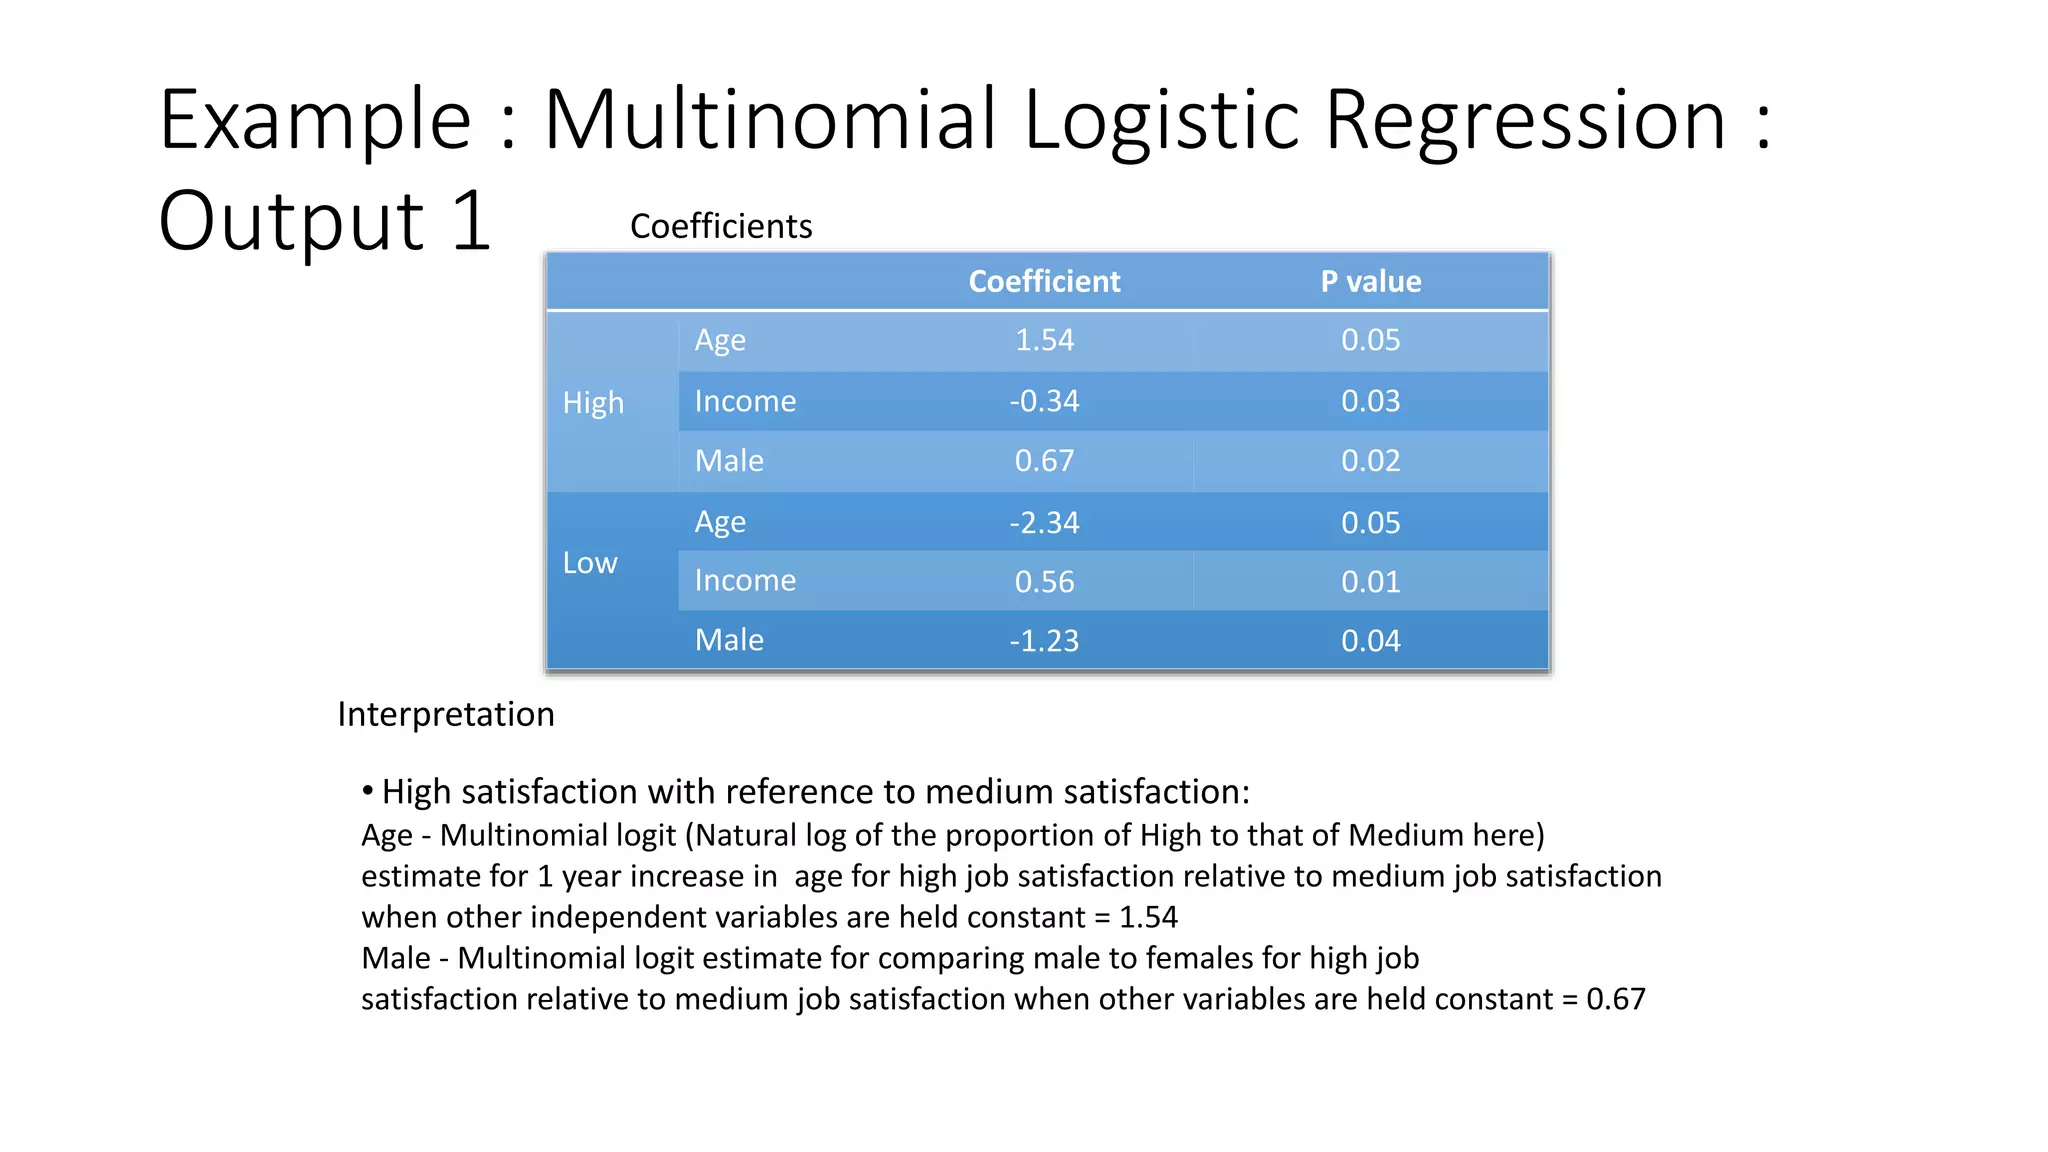
Let's use the output from our high school program example in the reading to interpret the coefficients.
A. Interpreting Coefficients as Log-Odds
The raw coefficients are on the log-odds scale.
-
Coefficient for
ses="low" (vs. high) ongeneral: The reading notes the coefficient is -1.125.- Interpretation: For a student with low SES compared to a student with high SES, the log-odds of being in the
generalprogram versus theacademicprogram decrease by 1.125. This suggests low-SES students are less likely to choose the general program over the academic one, compared to high-SES students.
- Interpretation: For a student with low SES compared to a student with high SES, the log-odds of being in the
-
Coefficient for
mathonvocational: The coefficient is -0.504.- Interpretation: For each one-point increase in a student's math score, the log-odds of being in the
vocationalprogram versus theacademicprogram decrease by 0.504. Higher math scores make it less likely a student will choose a vocational path over an academic one.
- Interpretation: For each one-point increase in a student's math score, the log-odds of being in the
B. Interpreting Coefficients as Odds Ratios
To make the interpretation more intuitive, we exponentiate the coefficients to get odds ratios.
Let's use the odds ratios provided in the R lab reading (exp(coef(multi_mo))).
-
Odds Ratio for
ses="middle" (vs. high) onvocational: The coefficient is0.840. The odds ratio is .- Interpretation: The odds of choosing the
vocationalprogram over theacademicprogram are 2.31 times higher for a student from a middle-SES background compared to a student from a high-SES background.
- Interpretation: The odds of choosing the
-
Odds Ratio for
mathongeneral: The coefficient is-0.185. The odds ratio is .- Interpretation: For each one-point increase in math score, the odds of choosing the
generalprogram over theacademicprogram are multiplied by 0.83 (i.e., they decrease by about 17%).
- Interpretation: For each one-point increase in math score, the odds of choosing the
Notice every interpretation specifies the comparison category (general vs academic) and the reference group for the predictor if it's categorical (middle SES vs high SES).
4. From Coefficients to Probabilities
Interpreting individual coefficients is crucial, but it can be hard to see the big picture, especially with many predictors. A more holistic way to understand the model is to use it to predict the probability of each outcome for specific profiles of interest.
In the last lesson, you saw the softmax formula that turns log-odds into probabilities. Let's see it in action.
Multinomial Logistic Regression: Complete Guide
The following article gives a step-by-step manual calculation of probabilities for a new observation. This is an excellent way to solidify your functional understanding of how the coefficients work together.
Please read the sections 'Manual Calculation' and 'Interpretation'. This walks through taking a new data point (age=25, income=30), plugging it into the linear equations for each category, and using the results to calculate the final probabilities.
This process allows us to make powerful summary statements. For our high school example, we could calculate the predicted probabilities for two hypothetical students:
- Student A: Low SES, 40 math score, 40 science score
- Student B: High SES, 70 math score, 70 science score
We would likely find that Student A has a higher probability of being in the vocational or general program, while Student B has a very high probability of being in the academic program. This is often more insightful than interpreting each coefficient in isolation.
5. Visualizing the Model's Predictions
When you have two continuous predictors, you can create a plot of the decision boundaries. This plot shows how the model divides the predictor space into regions where each outcome category is the most likely.

This visualization provides an excellent intuitive feel for what the model has learned. The coefficients we interpret define the precise location and slope of these boundaries. The model essentially learns a set of rules to partition the data, and the decision boundaries are the visual representation of those rules.
Conclusion
In this lesson, we bridged the gap from theory to practice, focusing on how to fit a multinomial logistic regression model and interpret its output.
Key Takeaways:
- A multinomial model with a
K-category outcome producesK-1sets of coefficients, each comparing an outcome category to a chosen reference category. - Coefficients can be interpreted as either log-odds or, more intuitively, as odds ratios. The interpretation must always state the two outcome categories being compared (e.g.,
vocationalvs.academic). - While coefficient-level interpretation is detailed, a more holistic understanding comes from calculating and comparing predicted probabilities for different predictor profiles.
- Decision boundaries provide a powerful visual representation of how the model classifies observations based on their predictor values.
Preview of the Next Lesson:
We've now covered models for binary outcomes and nominal outcomes. But what if the categories have a natural order (e.g., "low," "medium," "high")? Standard multinomial regression ignores this ordering. In our next lesson, we will explore ordinal logistic regression, a model specifically designed to leverage the information contained in ordered categorical variables.