Hello! Welcome to the next stage of our journey into categorical data analysis.
In our last few lessons, we've focused entirely on binary logistic regression, where the outcome variable has only two possible categories (e.g., "Healthy" vs. "Unhealthy"). We concluded with a practical session on fitting, interpreting, and evaluating these models in R.
Today, we'll expand our toolkit to handle situations where the outcome has more than two categories. Specifically, we will focus on multinomial logistic regression. Our goal is to understand when this model is the right tool for the job and to deconstruct its fundamental structure, paying close attention to the crucial concept of a "reference category."
1. When to Use Multinomial Logistic Regression
The first question to ask when choosing a model is: "What does my dependent variable look like?"
- If it's continuous (like blood pressure or income), linear regression is often a good starting point.
- If it's binary (like pass/fail or yes/no), we use binary logistic regression.
But what if your outcome has multiple categories, like a person's preferred mode of transport (car, bus, train) or their voting intention (Party A, Party B, Party C)? This is where multinomial logistic regression comes in. It's designed for a nominal dependent variable with three or more categories, where the categories have no natural order.
To get a clear and intuitive sense of these distinctions, let's watch the beginning of this video.
An Intuitive Introduction to the Multinomial Logit
The video 'An Intuitive Introduction to the Multinomial Logit' from Doug McKee's channel clearly explains the scenarios where different regression models are used based on the type of outcome variable.
Please watch from the beginning to 07:17. Focus on the examples given for each type of dependent variable (continuous, binary, ordered, and multinomial) to solidify your understanding of when multinomial logistic regression is the appropriate choice.
As the video highlighted, using a simple linear regression for a multinomial outcome (e.g., coding 'walk' as 1, 'bike' as 2, 'drive' as 3) doesn't make sense because there's no inherent quantitative meaning to the numbers or the distances between them. We need a model specifically designed for this type of unordered categorical choice.
2. The Structure of the Multinomial Model
So, how does it work? Multinomial logistic regression is best understood as a clever extension of the binary logistic regression model you're already familiar with.
Instead of trying to model all K categories at once, the model simplifies the problem by:
- Choosing one category to be the baseline or reference category.
- Building
K-1separate binary-style logit models, where each model compares one of the other categories to this single reference category.
This video provides a great introduction to this core idea.
Multinominal logistic regression, Part 1: Introduction
The video 'Multinominal logistic regression, Part 1: Introduction' from NCRM gives a concise overview of how the model is structured around a reference category.
Please watch from 02:15 to 03:56 and from 06:25 to 07:44. The first segment introduces the concept of building K-1 models relative to a baseline. The second segment shows the resulting model equations for a three-category outcome.
As you saw, for an outcome with K categories, we end up with K-1 equations. If our outcome is Y with categories {A, B, C} and we choose C as the reference, the model will consist of two simultaneous equations:
- A logit model for the odds of choosing A versus C.
- A logit model for the odds of choosing B versus C.
This is often called a baseline-category logit model.

The general form for one of these K-1 equations looks like this:
Here, is the reference category, and this equation is one of the K-1 equations where . Notice that for each non-reference category k, there is a unique set of coefficients ().
Why is a Reference Category Necessary?
You might wonder why we can't just have K equations for K categories. The reason is a statistical concept called identifiability. Without a constraint, the model is "overparameterized," meaning multiple different sets of coefficients could produce the exact same predicted probabilities. By setting one category's coefficients to zero (making it the reference), we anchor the model and ensure there is a single, unique solution for the coefficients.
Multinomial Logistic Regression: Complete Guide
This article provides a clear explanation of why the reference category is essential for making the model identifiable.
Please read the short subsection titled 'Identifiability and Constraints'. This will give you the formal reason behind the necessity of a reference category.
3. The Role of the Reference Category in Practice
Since the reference category is so central, how we choose it and how it affects our interpretation are critically important.
A. Choosing a Reference Category
The choice of reference category is up to you, the analyst. While it doesn't change the model's overall fit or predictive power, it fundamentally changes the interpretation of the coefficients.
Multinominal logistic regression, Part 1: Introduction
Let's return to the NCRM video, which offers practical advice on how to select a suitable reference category.
Please watch from 03:56 to 06:25. Pay attention to the different strategies for choosing a baseline (e.g., most meaningful, most frequent) and the key advice on what to avoid.
Common strategies for choosing the reference category include:
- A "natural" baseline: For example, in a medical study with outcomes {Treatment A, Treatment B, Placebo}, the 'Placebo' group is a natural reference.
- The largest group: Choosing the most frequent category can sometimes lead to more stable estimates.
- The first or last category if there's a slight logical ordering.
The most important rule is to avoid using a very rare category as the reference, as this can lead to unstable and difficult-to-interpret results.
B. Interpreting Coefficients with a Reference Category
This is the most crucial part of understanding the model's structure. Every coefficient is interpreted as the change in the log-odds of being in a specific category relative to the reference category.
Let's break this down with an example.
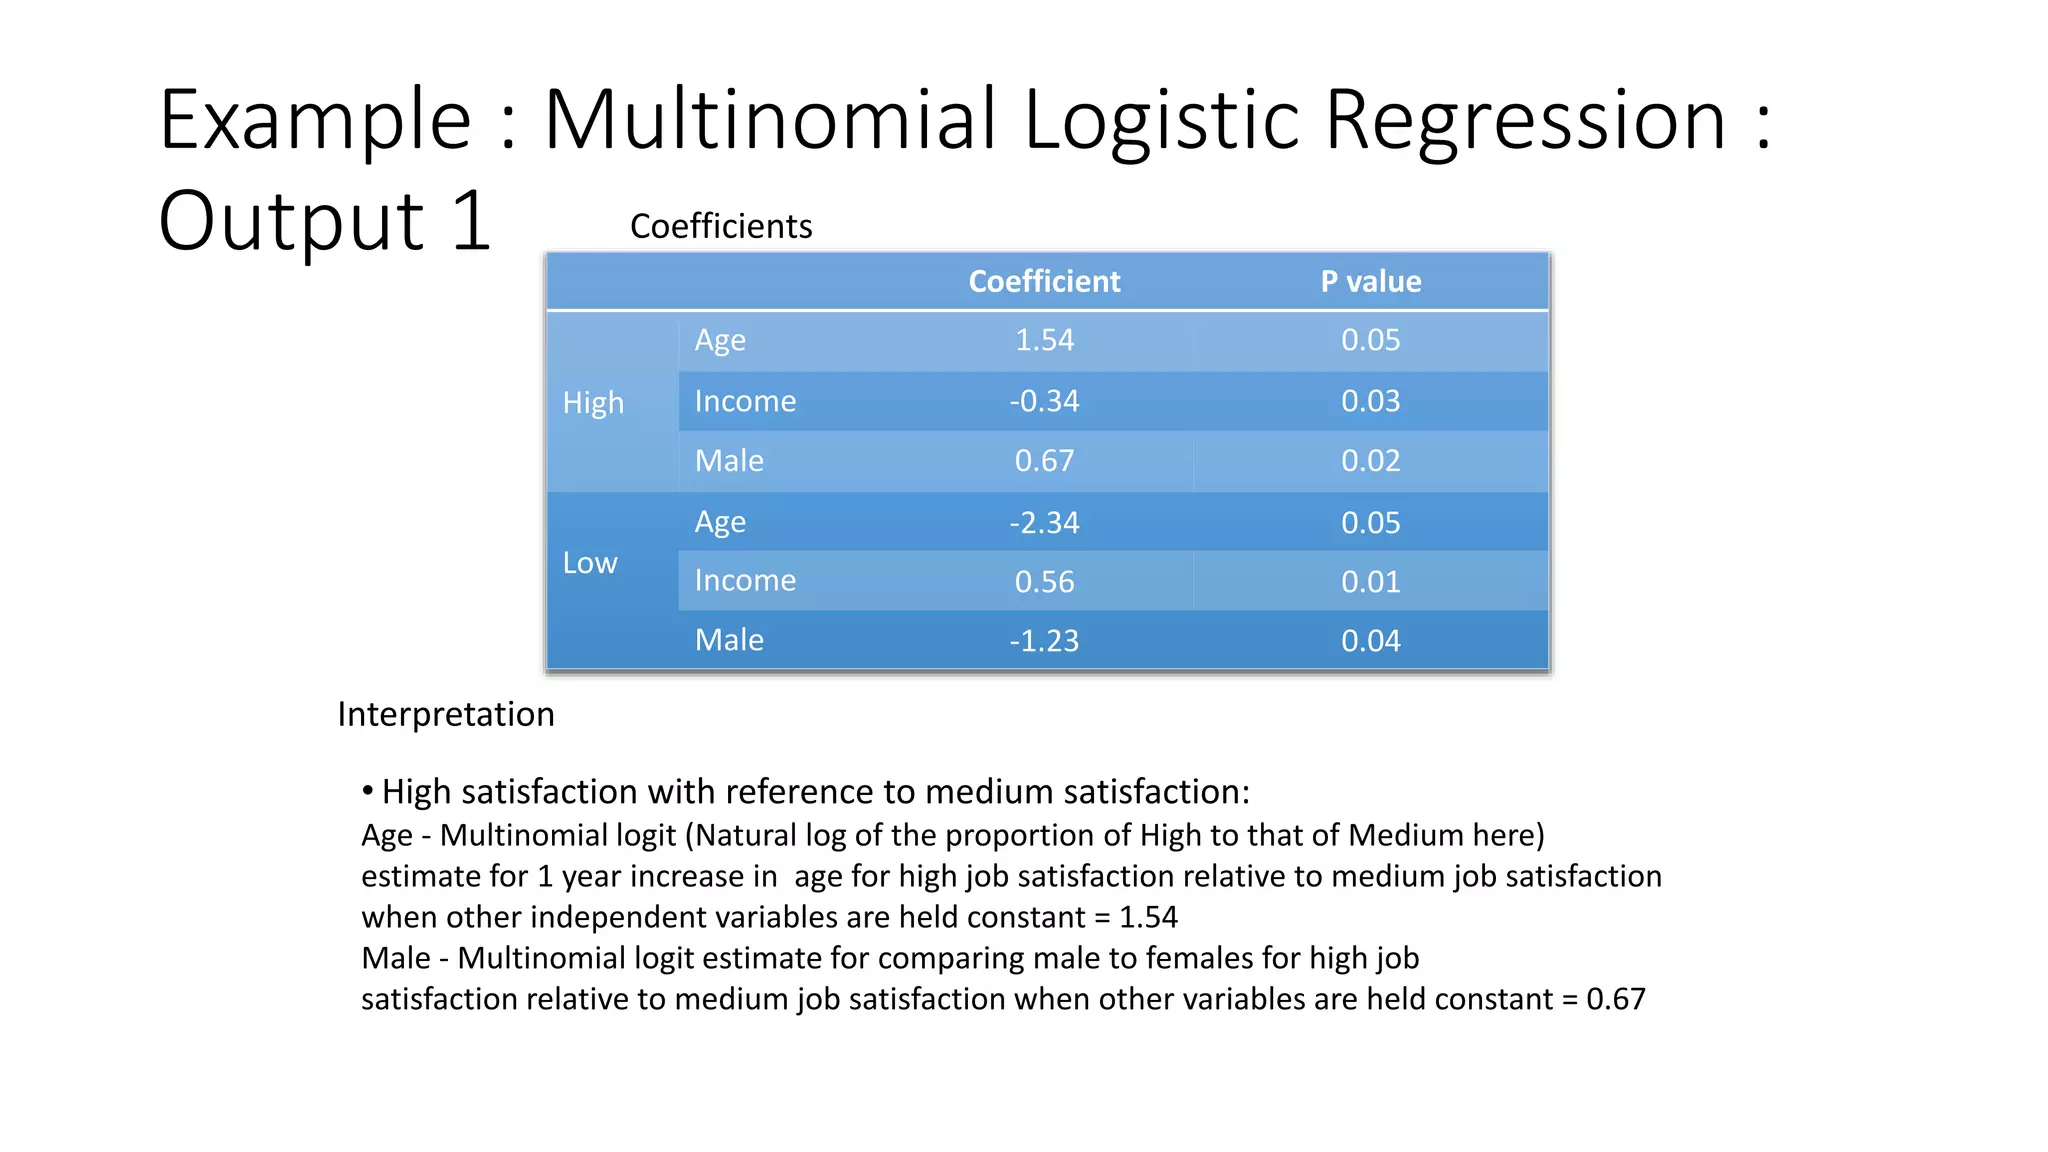
Look at the table in the image above. The reference category is 'Medium' satisfaction. This means we have two sets of coefficients:
- One for
High vs. Mediumsatisfaction. - One for
Low vs. Mediumsatisfaction.
Let's interpret the coefficient for Age in the High satisfaction group, which is 0.025.
- This means that for a one-year increase in age, the log-odds of having 'High' satisfaction versus 'Medium' satisfaction increase by 0.025, holding other variables constant.
- Exponentiating this gives us the odds ratio: . This means the odds of having 'High' satisfaction versus 'Medium' satisfaction are about 2.5% higher for each additional year of age.
It's vital to always include the "versus the reference category" part in your interpretation.
For a more detailed explanation of coefficient interpretation, please read the following section from a Penn State statistics course.
Please read the subsection 'Interpretation of Parameter Estimates'. This text reinforces the key idea that coefficients represent the change in log-odds of being in one category versus the baseline category.
4. From Log-Odds to Final Probabilities
The model directly estimates K-1 sets of log-odds. But what we ultimately want is the predicted probability for each of the K categories. How does the model get there?
The K-1 linear equations for the log-odds are solved simultaneously, and the results are transformed using a function called the softmax function. The purpose of the softmax function is to take the K-1 log-odds values (plus a 0 for the reference category) and convert them into K probabilities that are all non-negative and sum to 1.
You don't need to memorize the derivation, but seeing a concrete calculation is the best way to understand how it works functionally.
Multinomial Logistic Regression: Complete Guide
The following article contains a fantastic, step-by-step manual calculation that shows exactly how the model's coefficients are used to generate final predicted probabilities for a new observation.
Please read the section titled 'Example', starting from 'Manual Calculation' and going through 'Step 5: Verification'. Follow the steps to see how the coefficients for a new data point are used to compute the linear predictors (log-odds), which are then exponentiated and normalized to produce the final probabilities for each category.
This step-by-step process demystifies the model, showing that it's a logical sequence:
- Calculate a score (the linear predictor, or log-odds) for each category relative to the baseline.
- Exponentiate these scores.
- Normalize them so they sum to 1, yielding a probability for each category.
Conclusion
In this lesson, we've laid the conceptual groundwork for multinomial logistic regression. You now have a functional understanding of what it is, when to use it, and how its structure is defined by the crucial choice of a reference category.
Key Takeaways:
- When to Use: Multinomial logistic regression is appropriate for a dependent variable with three or more nominal (unordered) categories.
- Core Structure: The model works by selecting one reference category and building
K-1logit models that each compare another category to this baseline. - The 'Why': A reference category is necessary to ensure the model is identifiable and has a unique set of coefficients.
- Interpretation: Coefficients represent the change in log-odds of being in a specific category versus the reference category for a one-unit change in a predictor.
Preview of the Next Lesson:
Now that we've established the theoretical framework, our next step is to put it into action. In the next lesson, we will focus on fitting a multinomial logistic regression model to real data and, most importantly, practice interpreting the full set of coefficients from the model's output.