Hello! Welcome to our next lesson on Data Governance with Unity Catalog.
In the previous lessons, we focused on securing data by defining who can access what, using permissions and dynamic views with functions like current_user() and is_account_group_member(). Now, we shift our focus from "who" can access data to "what" has happened to the data throughout its lifecycle. This is the concept of data lineage.
Understanding the journey of your data—from its origin through various transformations to its final use in reports or models—is a cornerstone of modern data governance. In physics, you might track the trajectory of a particle, observing its interactions and state changes over time. Similarly, data lineage allows us to trace the path of data, providing crucial context for trust, compliance, and debugging.
Today, we'll dive into how Unity Catalog automates this process. Our learning outcome is to trace data lineage for tables and columns using the Unity Catalog UI. We'll explore why lineage is important, how it's captured, and most importantly, how to navigate the UI to visualize it effectively.
1. What is Data Lineage and Why is it Important?
Data lineage is the story of your data's lifecycle. It answers fundamental questions:
- Where did this data come from? (Upstream sources)
- What transformations has it undergone? (Jobs, notebooks, queries)
- Where is this data being used? (Downstream tables, views, dashboards)
Data Lineage with Databricks Unity Catalog
To start, let's get a clear definition of data lineage and its significance. This short article by Jay Wang on Medium provides an excellent, concise overview.
Please read the first two sections, 'What is Data Lineage?' and 'Unity Catalog and Data Lineage'. Focus on the three key reasons why lineage is important: Traceability, Compliance, and Impact Analysis.
To see these benefits in action, let's watch a brief introductory video from Databricks.
Automated Data Lineage with Unity Catalog
This video, 'Automated Data Lineage with Unity Catalog', quickly demonstrates the value proposition of this feature.
Watch the first minute of the video (00:00 - 00:56). Pay attention to the three broad use cases mentioned: compliance, discovery, and observability.
As you can see, lineage isn't just an audit feature; it's a critical tool for data engineers, analysts, and scientists to understand, trust, and debug their data pipelines.
2. How Unity Catalog Captures Lineage
One of the most powerful features of Unity Catalog is that it captures lineage automatically at runtime for any query executed via the Databricks SQL or DataFrame interfaces. This means that as you run your notebooks, jobs, and DLT pipelines, Unity Catalog is building a map of your data flows in the background.
However, for this automatic capture to work, certain conditions must be met, and it's also important to be aware of its limitations. These are common topics for the certification exam.
View data lineage using Unity Catalog | Databricks on AWS
The official Databricks documentation provides the definitive guide on the requirements for capturing lineage and its current limitations. Understanding these is essential for troubleshooting and for the exam.
Please read the following two sections from the documentation: 'Requirements': Note that tables must be in Unity Catalog and queries must use the Spark interfaces. 'Lineage limitations': Pay close attention to key limitations such as the one-year retention period, what is not captured (e.g., RDDs, lineage obscured by UDFs), and how renamed objects are handled.
3. Hands-On: Exploring Lineage in the UI
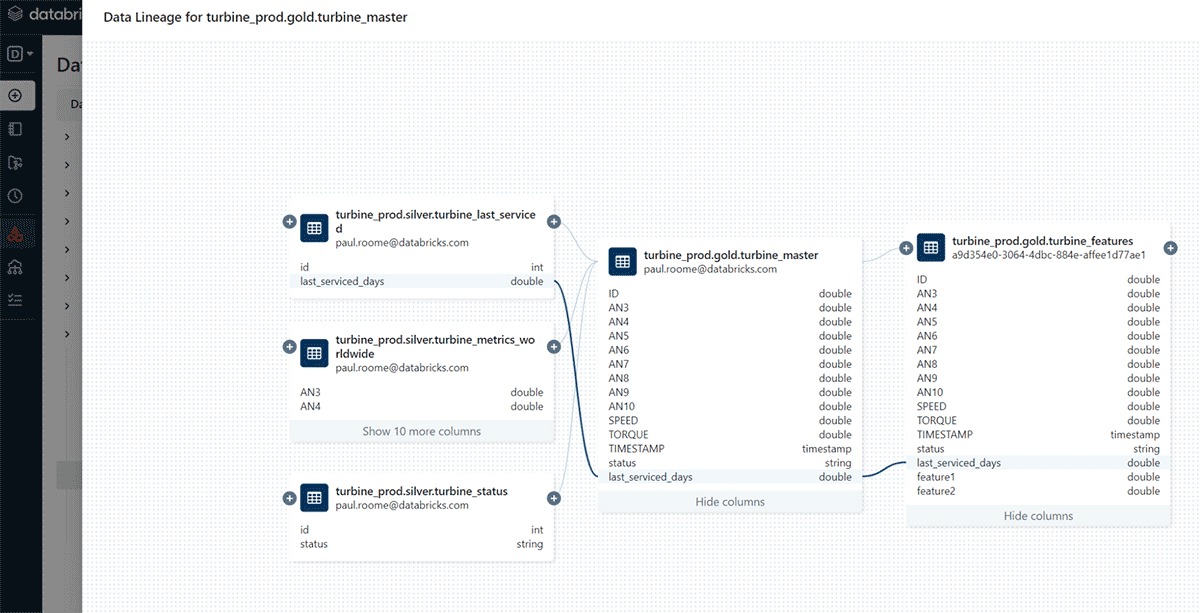
Now for the most important part: learning by doing. We'll explore the lineage UI in Catalog Explorer. The interface provides an interactive graph to visualize data flows at the table, view, dashboard, notebook, and job levels.
Exploring the Lineage Graph
The lineage graph is your primary tool for tracing data. Let's walk through how to use it.
Databricks Unity Catalog Tutorial - Data Governance made easy
This video provides a clear, practical demonstration of navigating the lineage UI.
Watch the segment from 19:55 to 21:30. The presenter clearly explains how to access the lineage graph and interpret upstream vs. downstream lineage. Notice how they also point out the link to the notebook that created the table.
The key components you'll interact with are:
- Upstream vs. Downstream: Upstream shows where the data came from; downstream shows where it's going.
- Nodes: These represent data assets (tables, views) or workloads (notebooks, jobs).
- Column-Level Lineage: You can click on a column to see its specific end-to-end journey.

Practical Exercise: Generate and Trace Your Own Lineage
Let's create a simple data pipeline using SQL to generate some lineage data that you can then explore.
Instructions:
-
In a new SQL notebook in your Databricks workspace, make sure you have selected a catalog and schema where you have
USE CATALOG,USE SCHEMA, andCREATE TABLEpermissions. -
Step 1: Create a Raw Data Table. This will be our source.
CREATE OR REPLACE TABLE sales_raw ( sales_id INT, customer_name STRING, amount DECIMAL(10, 2), sale_date DATE ); INSERT INTO sales_raw VALUES (1, 'Alice', 100.00, '2023-11-01'), (2, 'Bob', 250.50, '2023-11-02'), (3, 'Alice', 75.25, '2023-11-05'); -
Step 2: Create a Transformed Table. This table will be derived from our raw table.
CREATE OR REPLACE TABLE sales_transformed AS SELECT sales_id, customer_name, amount * 1.08 AS amount_with_tax, -- Add 8% tax sale_date, YEAR(sale_date) as sale_year FROM sales_raw; -
Step 3: Create a Report View. This view aggregates data from the transformed table.
CREATE OR REPLACE VIEW customer_sales_report AS SELECT customer_name, SUM(amount_with_tax) as total_sales FROM sales_transformed GROUP BY customer_name; -
Step 4: Explore the Lineage. Now, navigate to Catalog Explorer (
Dataicon in the left sidebar).- Find your
sales_transformedtable. - Click on the Lineage tab.
- Click See Lineage Graph.
- Find your
Your Tasks:
- Identify the upstream table and downstream view connected to
sales_transformed. - Expand the columns for each table in the graph. Click on the
amount_with_taxcolumn insales_transformed. Which column in thesales_rawtable is its ancestor? - Close the graph and, still on the Lineage page, click the Notebooks tab. You should see a link to the notebook you just used to create the table. This is how you trace back to the exact code that produced the data.
4. Lineage and Permissions
Just like everything else in Unity Catalog, lineage is governed by permissions. Your ability to see assets in the lineage graph depends on your privileges.
In short, if you don't have at least BROWSE or SELECT privilege on a table, you won't be able to see its details in the lineage graph. The object will appear as a "masked" node, protecting sensitive information about its structure or existence. This ensures that data discovery through lineage still respects the security boundaries you've established.
View data lineage using Unity Catalog | Databricks on AWS
To understand how security and lineage interact, please review this section of the documentation.
Read the section 'Lineage permissions'. Focus on the example of what userA vs userB can see based on their different grants. This reinforces concepts from our previous lessons on privileges.
Conclusion
In this lesson, we've explored how Unity Catalog provides powerful, automated data lineage capabilities. This feature is fundamental to building a trustworthy and governable data lakehouse.
Key Takeaways
- Data Lineage tracks the entire lifecycle of data, from its source to its consumption.
- It is critical for impact analysis, root cause analysis of data quality issues, and regulatory compliance.
- Unity Catalog automatically captures lineage for table and column-level operations performed through Spark SQL and DataFrames.
- You can visualize and interact with data lineage through the Lineage Graph in Catalog Explorer.
- The graph shows relationships between tables, views, notebooks, jobs, and dashboards.
- Access to view lineage information is governed by the standard Unity Catalog permission model.
Next Steps
Now that we can secure our data and trace its lineage, the final piece of the governance puzzle is making our data discoverable. In our next and final lesson of this module, we will learn how to use Unity Catalog to discover and search for data assets across the organization.