Hello! Welcome to your third lesson in the "Querying Data with Databricks SQL" module.
In our last session, you learned how to use JOINs to combine data from multiple tables, a fundamental skill for working with relational data. You saw how INNER, LEFT, RIGHT, and FULL OUTER joins allow you to create powerful, unified views of your data.
Today, we move from retrieving and combining individual rows to summarizing them. Data engineers are often tasked with creating reports, dashboards, or aggregated tables that provide high-level insights. Instead of looking at every single transaction, you might need to know the total sales per day, the average order value per customer, or the number of users per country. This process of calculation and summarization is called aggregation.
This lesson directly addresses the learning outcome: Use GROUP BY with aggregate functions (COUNT, SUM, AVG, MIN, MAX) to summarize data. We will explore the core functions that perform calculations and then learn how to apply them to specific groups within your data using the GROUP BY clause.
1. Understanding Aggregate Functions
Aggregate functions take a set of rows as input and return a single summary value. The five most common aggregate functions, which you need to know for the certification exam, are:
COUNT(): Counts the number of rows.SUM(): Calculates the sum of a set of values.AVG(): Calculates the average of a set of values.MIN(): Finds the minimum value in a set.MAX(): Finds the maximum value in a set.
Let's start with a quick video that introduces these five functions and shows what they do.
SQL Aggregate Functions | COUNT, SUM, AVG, MAX, MIN | #SQL Course 21
This video from Data with Baraa provides a clear, visual introduction to the five main aggregate functions. It will give you a solid conceptual foundation for each one.
Watch from the beginning to 04:43. Focus on how each function (COUNT, SUM, AVG, MAX, MIN) takes multiple values from the 'sales' column and returns a single result.
A Closer Look at COUNT
The COUNT function is particularly versatile and has a few variations you must understand. The key difference lies in how they handle NULL values and whether they count all rows or only unique values.
COUNT(*): Counts all rows in the group, including duplicates and rows withNULLvalues. This is the most common way to get a total row count.COUNT(column_name): Counts all rows wherecolumn_nameis notNULL. It ignoresNULLs.COUNT(DISTINCT column_name): Counts the number of unique, non-NULLvalues incolumn_name.
Understanding this distinction is crucial for accurate data analysis. For example, COUNT(*) from a customers table gives you the total number of customer records, while COUNT(phone_number) tells you how many of those customers have a phone number on file.
This next video provides an excellent, detailed explanation of these nuances.
Master the SQL SELECT statement part 06: Aggregate Functions, GROUP BY and HAVING clauses
In this segment from a video by Michael Fudge, we'll dive deeper into the COUNT function. Pay close attention to the examples showing the difference between COUNT(*), COUNT(column), and COUNT(DISTINCT column).
Watch from 03:29 to 09:02. Focus on how counting a column with NULL values produces a different result than COUNT(*).
2. Grouping Aggregations with GROUP BY
So far, we've applied aggregate functions to an entire table. But what if you want to find the total sales for each product category? Or the number of employees in each department?
This is where the GROUP BY clause comes in. It divides the rows of a table into groups based on the values in one or more columns. The aggregate functions then calculate a result for each of these groups.
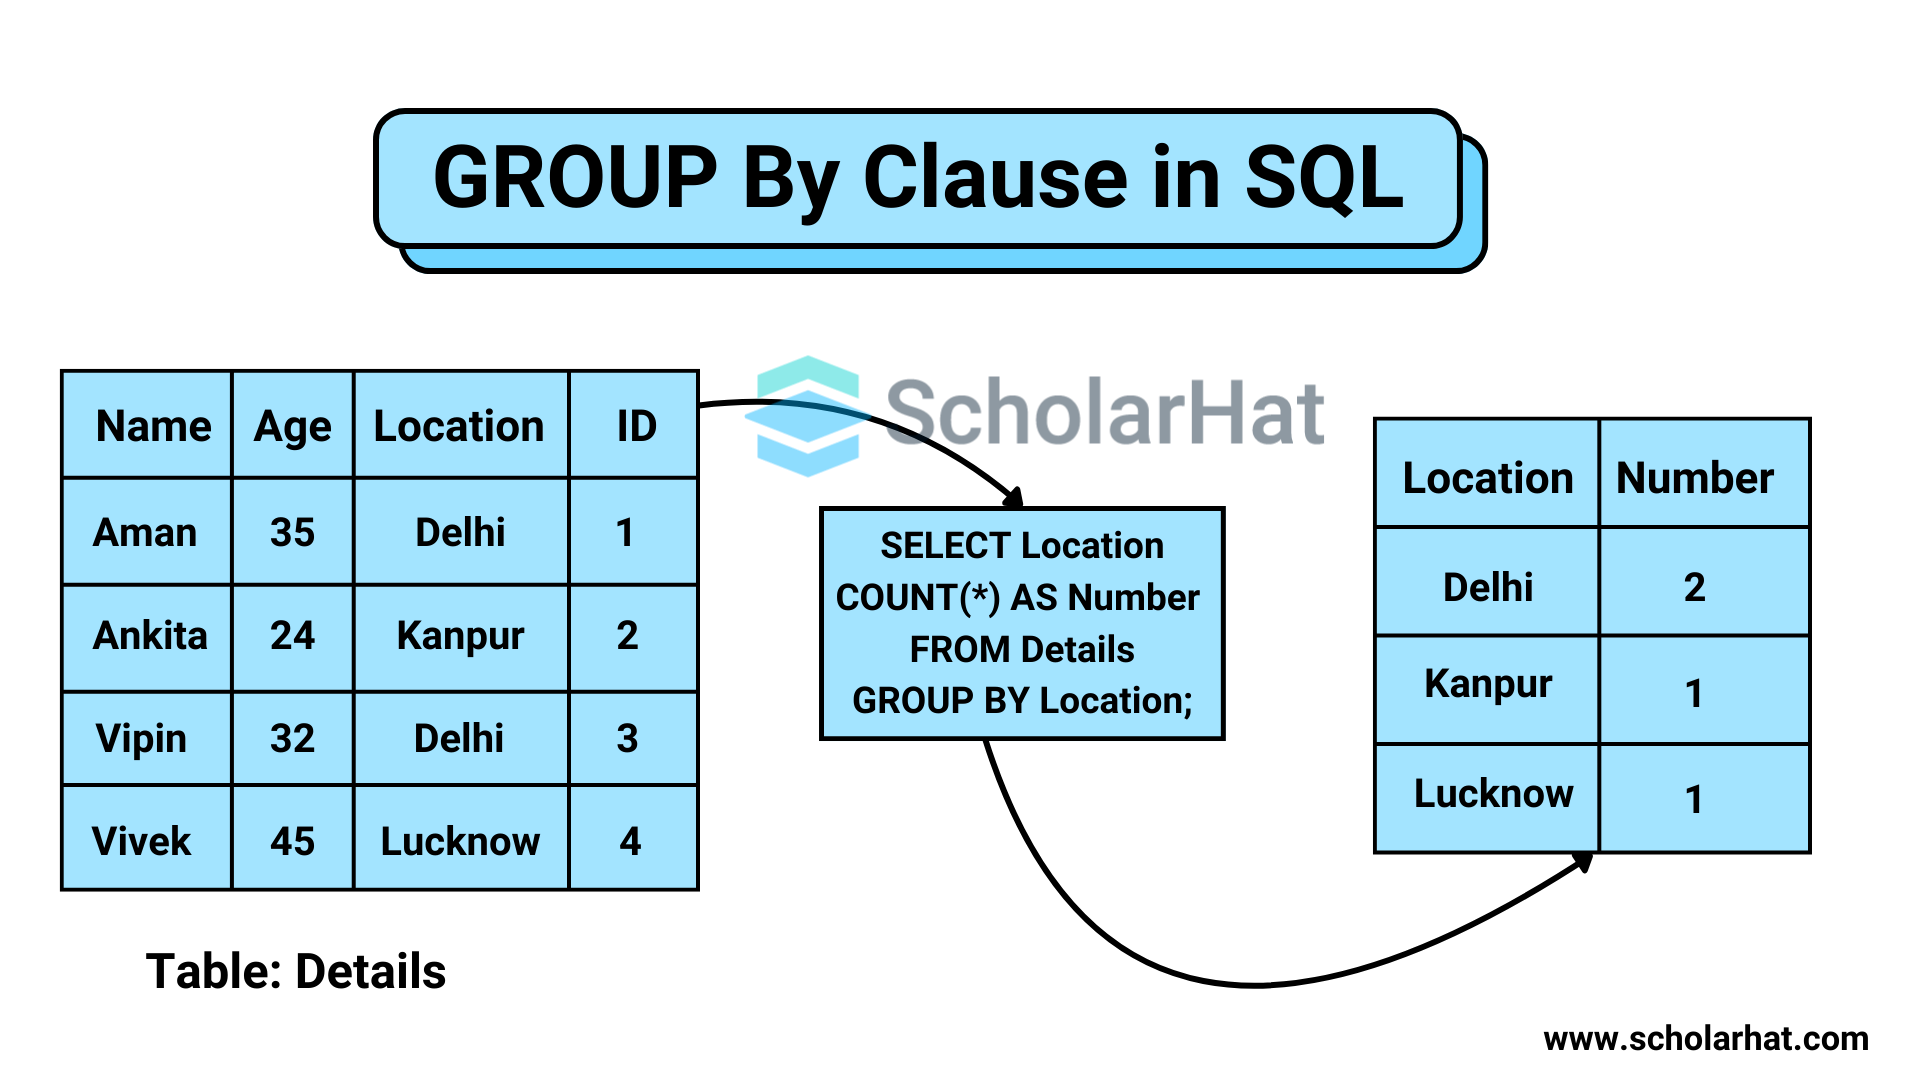
A critical rule to remember is: Any column in your SELECT list that is not part of an aggregate function must be included in the GROUP BY clause. If you violate this rule, the database won't know which row's value to display for a given group, and it will raise an error.
Let's watch a detailed walkthrough of how GROUP BY works.
Master the SQL SELECT statement part 06: Aggregate Functions, GROUP BY and HAVING clauses
This next segment from the same Michael Fudge video explains the purpose and syntax of the GROUP BY clause. It clearly demonstrates the common error of selecting a column that isn't aggregated or grouped.
Watch from 09:02 to 16:56. Pay attention to: The logic of 'for each change in this column, calculate an aggregate'. The error that occurs when you forget to include a selected column in the GROUP BY clause. How you can combine multiple aggregate functions (e.g., AVG, COUNT, MIN, MAX) in a single query.
Grouping by Multiple Columns and Using Joins
You can make your aggregations even more granular by grouping by multiple columns. For example, you could group sales data BY region, product_category to see a performance breakdown for each category within each region.
You can also combine GROUP BY with the JOINs you learned in the previous lesson. This is a very common pattern in data engineering. You might join an orders table with a customers table to find the total number of orders per customer.
The following video segment shows a practical example of this.
Master the SQL SELECT statement part 06: Aggregate Functions, GROUP BY and HAVING clauses
This final video segment demonstrates how to group by multiple columns and how to integrate a JOIN into your aggregation query to get more descriptive results.
Watch from 16:56 to 22:24. Notice how a JOIN is used to fetch the major's name, which is more readable than an ID, and then both the year and the major name are used in the GROUP BY clause.
3. Hands-On Practice in Databricks
Now it's time to apply these concepts in your Databricks workspace.
Instructions:
- Navigate to the SQL Editor in your Databricks workspace.
- Make sure a SQL Warehouse is running and selected.
- Copy and paste the following code into the editor and run it. This creates two temporary views (
dealeranddealership_info) that we will use for our exercises.
CREATE OR REPLACE TEMP VIEW dealer(id, city, car_model, quantity) AS
VALUES
  (100, 'Fremont', 'Honda Civic', 10),
  (100, 'Fremont', 'Honda Accord', 15),
  (100, 'Fremont', 'Honda CRV', 7),
  (200, 'Dublin', 'Honda Civic', 20),
  (200, 'Dublin', 'Honda Accord', 10),
  (200, 'Dublin', 'Honda CRV', 3),
  (300, 'San Jose', 'Honda Civic', 5),
  (300, 'San Jose', 'Honda Accord', 8);

CREATE OR REPLACE TEMP VIEW dealership_info(dealership_id, name) AS
VALUES
  (100, 'Fremont Auto'),
  (200, 'Dublin Cars'),
  (300, 'SJ Motors');

-- You can query them to see their contents
-- SELECT * FROM dealer;
-- SELECT * FROM dealership_info;
Now, write a SQL query for each of the following tasks. Try to solve them yourself before looking at any examples.
Practice Questions:
- Simple Aggregation: Calculate the total number of cars (
quantity) available across all dealerships. - Single-Column
GROUP BY: Find the total quantity of cars for each dealershipid. - Multiple Aggregations: For each dealership
id, find the total inventory (SUM), the number of different car models they carry (COUNT), and the largest number of any single car model they have in stock (MAX). GROUP BYwithJOIN: Write a query that shows the dealership name (not the ID) and its total car inventory. You will need to joindealeranddealership_info.- Multi-Column
GROUP BY: Count how many dealerships in eachcitycarry eachcar_model.
You can check your work against the official Databricks documentation, which contains similar examples.
GROUP BY clause | Databricks on AWS
This Databricks documentation page provides syntax and examples for the GROUP BY clause. Use the examples at the bottom of the page to check your answers and see different ways of using aggregations.
Refer to the code blocks under the 'Examples' section. The queries there use the same dealer view we created. Compare your results to the output shown in the documentation.
Conclusion
Excellent work! You have now mastered aggregation, one of the most fundamental and powerful capabilities of SQL. Combining SELECT, JOIN, and GROUP BY allows you to transform raw, row-level data into meaningful, high-level summaries.
Key Takeaways
- Aggregate functions (
COUNT,SUM,AVG,MIN,MAX) perform a calculation on a set of rows and return a single value. - The
GROUP BYclause is used to partition rows into groups, so aggregate functions can be applied to each group individually. - The distinction between
COUNT(*),COUNT(column), andCOUNT(DISTINCT column)is important for handlingNULLs and duplicates correctly. - Any non-aggregated column in the
SELECTlist must also be present in theGROUP BYclause. - You can (and often will) combine
JOINs withGROUP BYto create aggregated reports from multiple tables.
Next Steps
In the upcoming lesson, we will explore CASE expressions. This will add another layer of power to your queries by allowing you to implement conditional logic, similar to if/then/else statements in other languages. You'll be able to create your own custom categories on the fly and then use them within your GROUP BY clauses for even more sophisticated analysis.