Hello! Welcome back to the final module of our course.
In the last lesson, we took a major step in refining our system by assigning different priorities to our tasks. We ensured that the motor_control_task would be highly responsive by giving it a higher priority than the temp_sensor_task. This design should work well, but in engineering, we must verify our assumptions. How can we be sure that the scheduler is behaving as we expect? How do we know if our tasks have enough memory or if one task is unexpectedly hogging the CPU?
This brings us to today's crucial topic. We will learn how to use ESP-IDF tools to analyze task execution, CPU load, and memory usage of our integrated system. Think of these tools as the oscilloscopes, logic analyzers, and multimeters for our software. They allow us to peer inside the running system, measure its performance, and debug complex issues that are invisible from the outside.
1. Visualizing Your System with Segger SystemView
One of the most powerful tools at our disposal is Segger SystemView. It provides a real-time, graphical visualization of your application's behavior. Instead of guessing what your tasks are doing, you can see it unfold on a timeline.
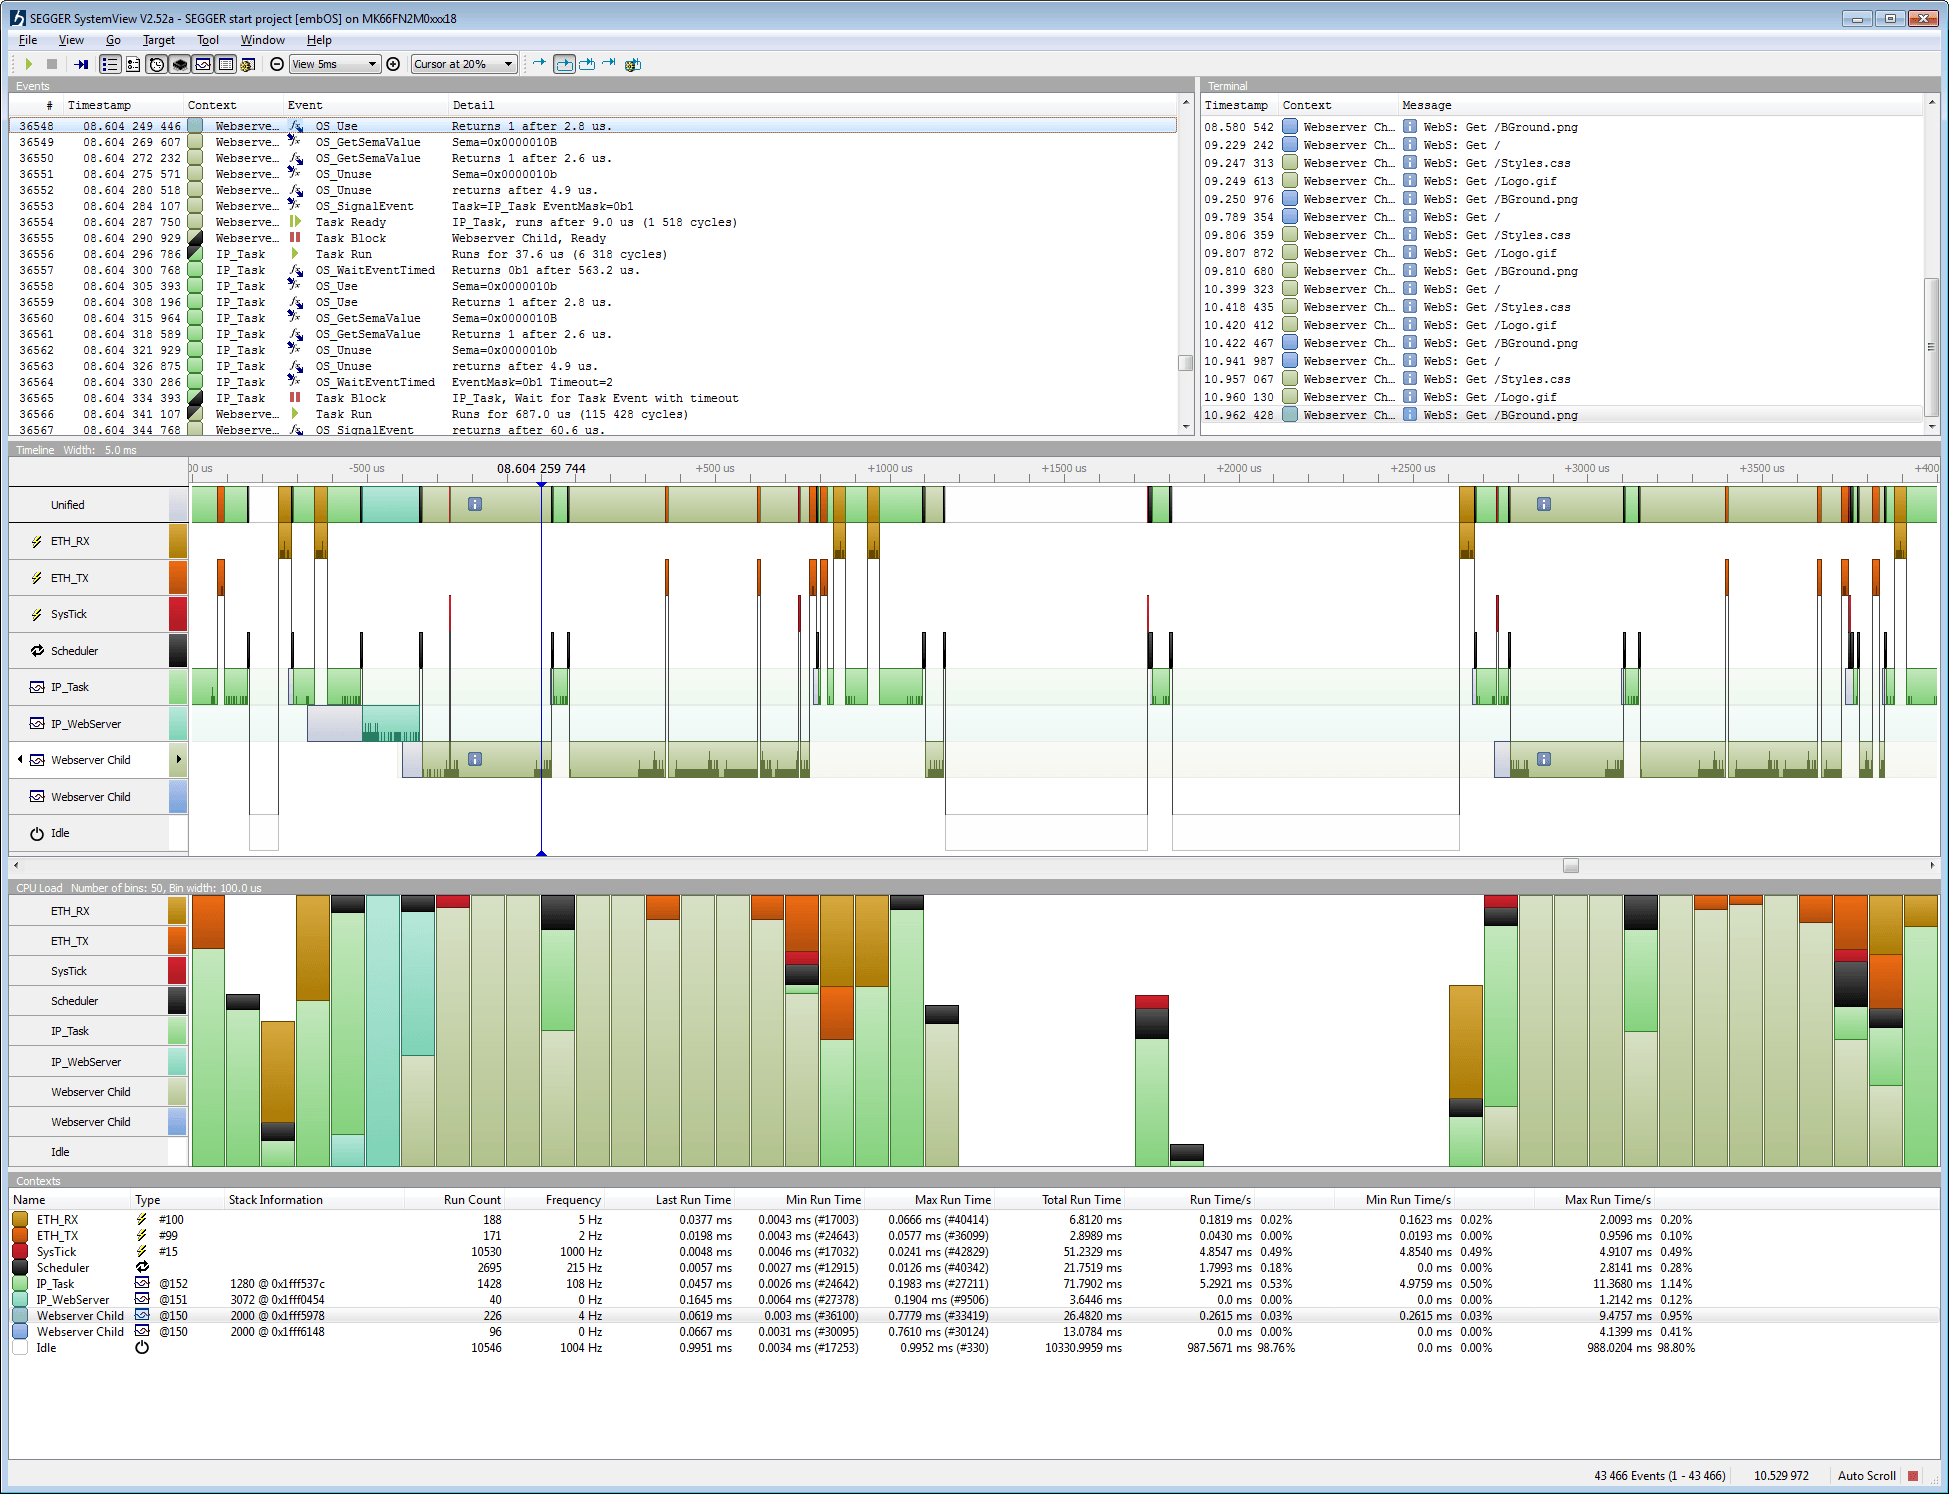
SystemView works by leveraging the Application Level Tracing library in ESP-IDF. Your ESP32 sends a stream of events (like "Task A started running," "Queue received a message," "ISR entered") over a JTAG connection to your computer. A tool called OpenOCD captures this data, and SystemView visualizes it.
Setting Up and Capturing a Trace
The process involves configuring your project, then using a few command-line tools to capture the data. It can seem complex at first, but it follows a logical sequence.
My ESP32 Journey: Segger SystemView Profiling
The video 'My ESP32 Journey: Segger SystemView Profiling' by Kevin on YouTube provides an excellent end-to-end walkthrough of this entire process. We will use it as our primary guide.
First, watch from 10:30 to 12:21. This segment shows how to configure your project in menuconfig. The key steps are: Navigate to Component config -> Application Level Tracing. Set Data destination to JTAG. Enable FreeRTOS SystemView Tracing. Next, watch from 13:57 to 23:06. This is the core of the capture process. Pay close attention to the sequence: Run openocd in one terminal window. Connect to it using telnet localhost 4444 in another window. Use the esp sysview start ... command to begin capturing data to files. Let the application run for a bit. Use the esp sysview stop command to finish the capture.
While the video is an excellent practical guide, the official ESP-IDF documentation provides the formal background.
Application Level Tracing Library - ESP-IDF Documentation
For reference, skim through the official ESP-IDF documentation on the Application Level Tracing Library. This will reinforce what the video shows and provide more technical context.
Please read the following sections: The Overview to understand the purpose of the library. Configuration Options and Dependencies to see the menuconfig options officially documented. System Behavior Analysis with SEGGER SystemView to understand how ESP-IDF integrates with this tool. Focus on the 'How to use it' and the 'OpenOCD SystemView Tracing Command Options' subsections.
Analyzing the Trace Data
Once you have your trace files (pro.bin and app.bin), you can open them in the SystemView application.
My ESP32 Journey: Segger SystemView Profiling
Let's return to the video to see how to interpret the data.
Watch from 23:06 to 28:40. The presenter loads the captured files into SystemView and explains what you're seeing. Focus on: The timeline view, where you can see which task is running at any given moment on each core. The CPU load graph, which shows the percentage of processing time each task uses. How to distinguish between tasks running on the PRO_CPU (Core 0) and APP_CPU (Core 1).
When analyzing your project, you could use this to visually confirm that when a message is sent to the motor task's queue, it immediately preempts the sensor task, just as we designed in the last lesson. You could also identify if any task is running for too long and starving others.
You can even send your own custom messages from your code to the SystemView timeline for debugging, which is demonstrated from 28:59 in the same video (esp_sysview_v_printf). This allows you to mark specific events in your application logic, like "Motor command received" or "Target position reached".
2. Programmatic Health Checks
SystemView is invaluable for deep-dive analysis, but sometimes you just need to check vital signs programmatically. FreeRTOS provides built-in functions to poll the status of your tasks, which you can use to log system health or trigger alerts.
This approach is less intrusive than a full JTAG trace and can be built directly into your production firmware.
ESP32 FreeRTOS Scheduler Explained | Task Debugging ...
The article 'ESP32 FreeRTOS Scheduler Explained' provides a great summary of the key functions available for this purpose.
Please read the subsection titled 'Checking Task Runtime and Stack Usage'. It introduces the two main functions we will discuss: uxTaskGetStackHighWaterMark and vTaskGetRunTimeStats.
Analyzing Memory Usage
Memory corruption is a frequent source of bugs in embedded systems. A common cause is a stack overflow, where a task uses more stack memory than it was allocated, overwriting memory belonging to other tasks or data.
Stack Memory:
Every task has its own stack, used for local variables, function arguments, and return addresses. The uxTaskGetStackHighWaterMark() function is your primary tool for stack analysis. It returns the minimum amount of free stack space (in words) a task has had since it started. A low "high water mark" is a red flag that you are close to a stack overflow.
ESP32 Technical Tutorials: FreeRTOS Stack Space
To understand why stack overflows happen, this classic tutorial by Kolban is exceptionally clear.
Please watch from 3:27 to 7:32. The video explains that each task has its own stack and then provides a clear, practical demonstration of a stack overflow caused by an infinitely recursive function. Notice how increasing the allocated stack size allows the program to run longer.
You could create a simple "monitor" task that periodically checks the stack high water mark of all your critical tasks and prints a warning if any drop below a safe threshold (e.g., a few hundred bytes).
// Example of a monitoring function
void monitor_tasks(void *pvParameters) {
    while (1) {
        // Get stack high water mark for the motor task (assuming you have its handle)
        UBaseType_t motor_stack_hwm = uxTaskGetStackHighWaterMark(motor_task_handle);
        printf("Motor Task Stack HWM: %u words\n", motor_stack_hwm);

        // Check the sensor task
        UBaseType_t sensor_stack_hwm = uxTaskGetStackHighWaterMark(sensor_task_handle);
        printf("Sensor Task Stack HWM: %u words\n", sensor_stack_hwm);

        if (motor_stack_hwm < 200) {
            printf("WARNING: Motor task stack is getting low!\n");
        }

        vTaskDelay(pdMS_TO_TICKS(10000)); // Check every 10 seconds
    }
}
Heap Memory:
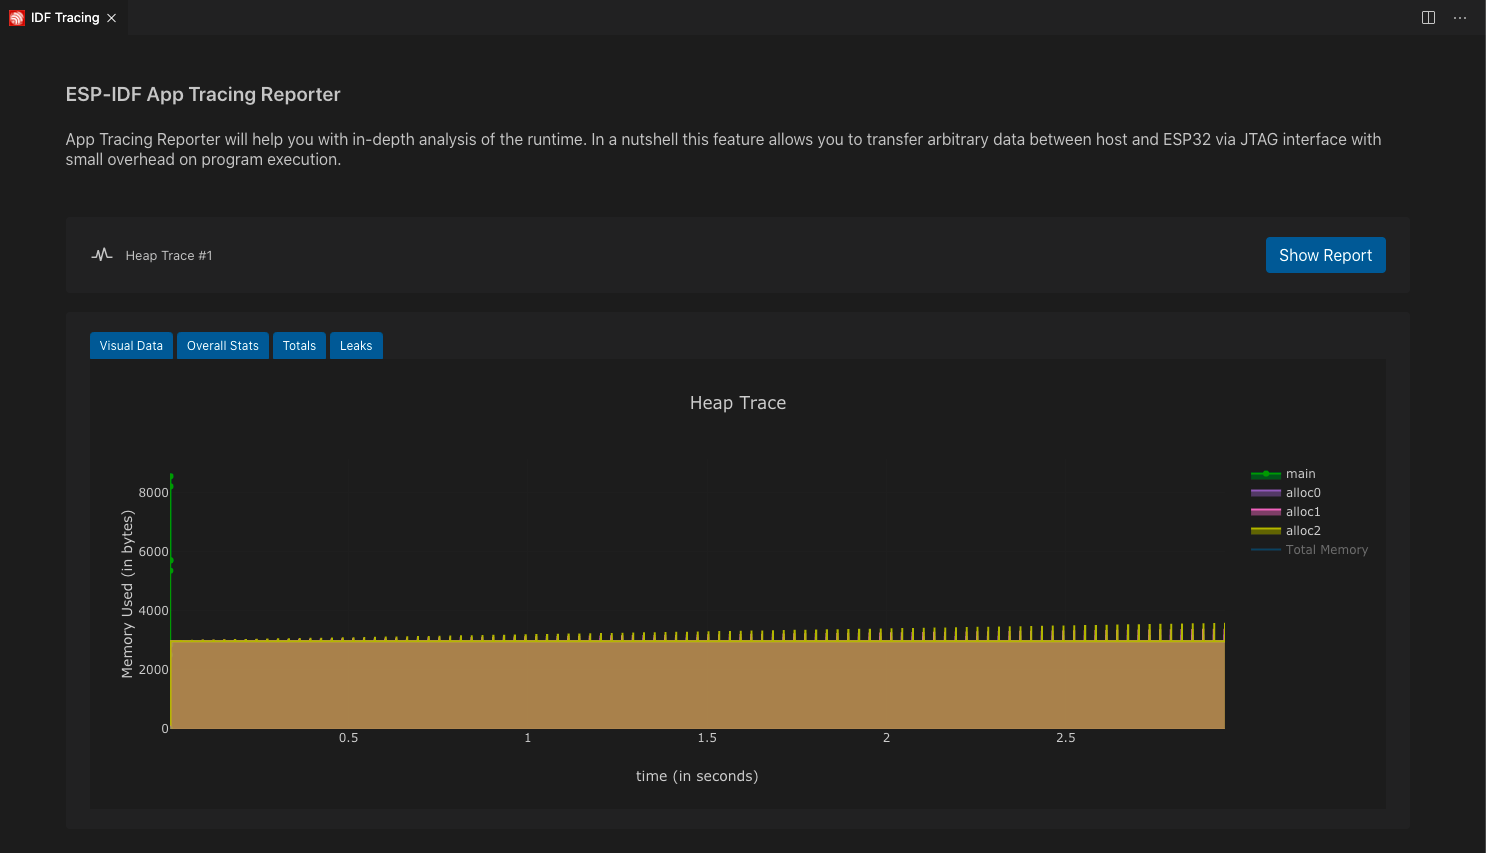
The heap is the pool of memory used for dynamic allocations (new, malloc). While we won't dive deep into heap analysis tools today, you can get a quick snapshot of available memory using esp_get_free_heap_size(). More advanced tools, like the one shown below, can trace heap usage over time to find memory leaks.
Analyzing CPU Load
To see how much processing time each task is consuming, you can use vTaskGetRunTimeStats(). This function generates a nicely formatted table showing the absolute run time and percentage of total CPU time for each task.
To use it, you first need to enable configGENERATE_RUN_TIME_STATS and related macros in your sdkconfig file (via menuconfig) or FreeRTOSConfig.h. Then, you can call the function like this:
// Buffer to hold the stats table
char stats_buffer[1024];

// Generate and print the stats
vTaskGetRunTimeStats(stats_buffer);
printf("--- Task Runtime Stats ---\n%s\n", stats_buffer);
This is an excellent way to quickly confirm that your system isn't overloaded and to identify any tasks that are consuming more CPU time than expected.
Test your understanding!
-
You run SystemView and notice the
IDLE0task is using 95% of the CPU time on Core 0. The other tasks you created (motor, sensor) are using less than 1% each. Is this a problem? -
You use
uxTaskGetStackHighWaterMark()on a task you allocated 8192 bytes (2048 words) of stack for. The function returns150. What does this tell you, and what should you do?
Show answer
-
No, this is not a problem; it's actually a good sign! The
IDLEtask only runs when no other task is ready to run. A high CPU load for the idle task means your system has plenty of spare processing capacity. It is not "wasting" CPU; it's simply indicating the CPU is available. -
A high water mark of 150 words means that at its peak usage, the task had only 150 words (600 bytes) of stack space left. This is a dangerously low margin for a task with an 8KB stack. It indicates the task is at a high risk of a stack overflow, which could lead to unpredictable crashes. You should significantly increase the stack size allocated to this task in
xTaskCreate().
Conclusion
Congratulations on completing this lesson! You've now learned how to move from designing a system based on theory to verifying its real-world performance through measurement and analysis.
Key Takeaways:
- Segger SystemView is a powerful tool for visualizing task execution, preemption, and CPU load, giving you a deep understanding of your system's dynamic behavior.
- SystemView relies on the ESP-IDF Application Tracing library, which sends event data from the ESP32 to your host computer via JTAG and OpenOCD.
- The
uxTaskGetStackHighWaterMark()function is essential for monitoring stack usage and preventing dangerous stack overflows. - The
vTaskGetRunTimeStats()function provides a quick, programmatic way to check the CPU load of all tasks in your system.
In our final lesson, we will put everything together. We will use the analysis tools you've just learned about to guide our efforts as we debug and optimize our multi-task application to meet performance requirements, such as response time and stability.