Hello! Welcome to your fifth lesson in the "Foundations of Clinical Research and Biostatistics" module.
In our last lesson, we learned how to describe and summarize the data we collect from a study sample using descriptive statistics. We can now calculate the mean blood pressure in a group treated with an Ayurvedic herb or count the percentage of patients whose symptoms improved. However, this raises a critical question: If we observe a difference between our treatment group and a placebo group, how do we know if it's a real effect of the treatment, or just random variation—the luck of the draw?
This lesson will equip you with the intellectual tools to answer that question. Our learning outcome is to explain the principles of statistical hypothesis testing, including p-values, Type I/II errors, and confidence intervals. This is the core framework that modern science uses to distinguish a genuine signal from background noise in research data. For your goal of subjecting Ayurvedic treatments to scientific scrutiny, mastering this framework is absolutely essential.
Part 1: The Logic of Scientific Comparison
At the heart of any clinical study is a comparison. We want to know if a new treatment is different from a placebo or an existing treatment. Statistical hypothesis testing gives us a formal procedure for making this comparison.
The Null and Alternative Hypotheses
The process begins by setting up two competing statements, or hypotheses:
-
The Null Hypothesis (): This is the hypothesis of "no difference" or "no effect." It's the skeptical, default position. It states that any difference we observe between groups in our study is just due to random chance.
- Example: For a study testing a new Ayurvedic formulation to reduce joint pain, the null hypothesis would be: "There is no difference in pain reduction between the group receiving the Ayurvedic formulation and the group receiving a placebo."
-
The Alternative Hypothesis ( or ): This is the opposite of the null hypothesis. It states that there is a real difference or effect. This is typically the hypothesis the researcher hopes to find evidence for.
- Example: "There is a difference in pain reduction between the group receiving the Ayurvedic formulation and the group receiving a placebo."
The goal of the researcher is not to prove the alternative hypothesis is true, but to gather enough evidence to reject the null hypothesis. This is similar to a legal trial: the defendant () is presumed innocent until proven guilty beyond a reasonable doubt. The researcher acts as the prosecutor, presenting data as evidence to try and reject the "presumption of innocence."
To get a clear and entertaining explanation of this fundamental concept, please watch the first part of the following video.
Statistics Introduction - Null Hypothesis, Odds ratio, Confidence Interval, p-value
The video 'Statistics Introduction' by Medicosis Perfectionalis provides a lively and memorable introduction to the null and alternative hypotheses using clear medical examples.
Watch from the beginning (or skip the intro to 01:47) until 04:34. Focus on the core idea of the null hypothesis as the 'no correlation' statement and the alternative as the 'correlation exists' statement.
Part 2: The Inevitable Risk of Making an Error
When we make a decision to reject or fail to reject the null hypothesis, our conclusion is based on data from a sample, not the entire population. Because of this, there's always a chance that our conclusion is wrong. In statistics, there are two specific types of errors we can make.
This is best visualized with a simple 2x2 table:
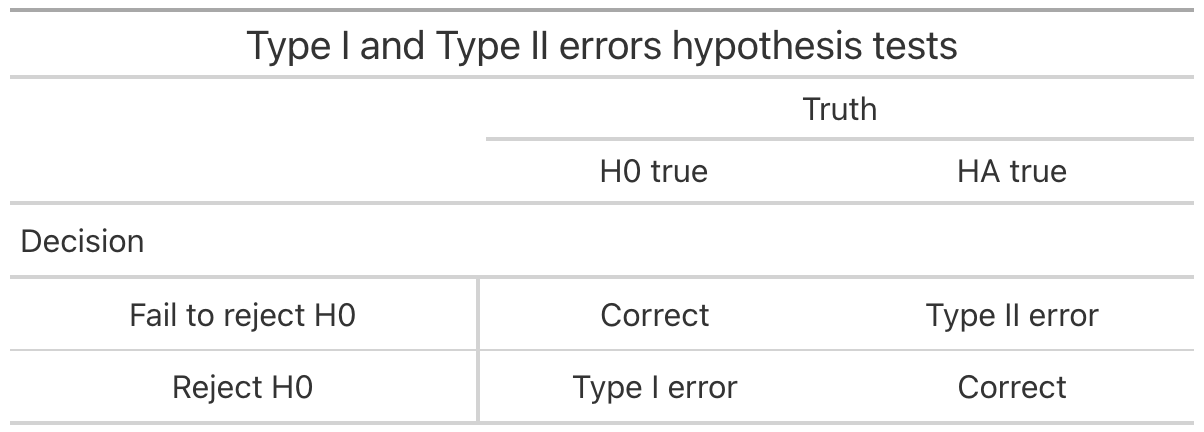
Let's define these errors:
-
Type I Error (α): A false positive. This is when you reject the null hypothesis when it is actually true.
- In our Ayurvedic example: We conclude that the herbal formulation for joint pain is effective, but in reality, it isn't. The difference we saw was just due to chance.
- The probability of making a Type I error is denoted by the Greek letter alpha (). When we conduct a study, we set a threshold for , typically at 5% (or 0.05). This is called the significance level.
-
Type II Error (β): A false negative. This is when you fail to reject the null hypothesis when it is actually false.
- In our Ayurvedic example: We conclude that the herbal formulation is not effective, when in reality, it is. We missed a real effect.
- The probability of making a Type II error is denoted by the Greek letter beta ().
Closely related to the Type II error is the concept of Statistical Power.
- Power (1 - β): This is the probability of correctly rejecting the null hypothesis when it is false. In other words, it's the probability of detecting an effect that is actually there. We want studies to have high power, typically 80% or more. The main way to increase a study's power is to increase its sample size.
The following video provides an excellent, detailed walkthrough of these two error types.
Statistics Introduction - Null Hypothesis, Odds ratio, Confidence Interval, p-value
This segment of the 'Statistics Introduction' video vividly explains Type I and Type II errors, using analogies like 'making up evidence' versus being 'blind to the evidence'.
Watch the section from 04:34 to 09:33. Focus on understanding the definition and consequence of each error type. Don't worry about memorizing the formulas, just grasp the concepts.
Part 3: Quantifying the Evidence — The p-Value
So, how do we decide if our evidence is strong enough to reject the null hypothesis? We calculate a p-value.
The p-value is a measure of evidence against the null hypothesis. It is defined as:
The probability of observing a result at least as extreme as the one in your sample, assuming the null hypothesis is true.
Let's break that down:
- We start by assuming is true (there is no real effect).
- Then we look at our study's result (e.g., the difference in pain scores between the herb and placebo groups).
- The p-value tells us how likely it is that we'd see a difference this large (or larger) just by random chance, if the herb truly had no effect.
How to Interpret the p-value:
- A small p-value (typically < 0.05) suggests that our observed result is very unlikely to have occurred if the null hypothesis were true. Therefore, we reject the null hypothesis and conclude the result is statistically significant.
- A large p-value (typically ≥ 0.05) suggests that our observed result is reasonably likely under the null hypothesis. Therefore, we fail to reject the null hypothesis and conclude the result is not statistically significant.
The conventional cutoff of 0.05 corresponds to the significance level () we mentioned earlier. It means we are willing to accept a 5% chance of making a Type I error.
The video below gives a very clear explanation of what a p-value is and, just as importantly, what it is not.
Null Hypothesis, p-Value, Statistical Significance, Type 1 Error and Type 2 Error
The video 'Null Hypothesis, p-Value...' by Stomp On Step 1 explains the p-value in a very structured way, connecting it directly to the null hypothesis and the alpha level.
Watch from 06:34 to 10:21. Pay close attention to the definition of the p-value and the rule for comparing it to alpha (0.05) to determine statistical significance.
A Critical Distinction: Statistical vs. Clinical Significance
It is crucial to understand that "statistically significant" does not automatically mean "clinically important." A very large study might find a tiny difference to be statistically significant (e.g., a p-value of 0.03 for a drug that lowers blood pressure by only 1 mmHg). While this effect may be "real," it might be too small to matter to a patient. Always consider the size of the effect, not just the p-value.
Part 4: Estimating the Effect — Confidence Intervals
The p-value gives us a yes/no answer about statistical significance, but it doesn't tell us about the magnitude or precision of our finding. This is where confidence intervals (CIs) are incredibly useful.
A Confidence Interval is a range of values calculated from the sample data that is likely to contain the true value of the population parameter. The most common is the 95% confidence interval.
- Interpretation: While the technical definition is complex, a practical interpretation is that we are "95% confident" that the true effect size in the population lies within this range. The CI gives us a plausible range for the true effect.
Using CIs for Hypothesis Testing:
Confidence intervals provide a clever way to assess statistical significance. Look for where the "no effect" value lies relative to the interval.
- For a difference (e.g., difference in mean blood pressure): The "no effect" value is 0. If the 95% CI does not include 0, the result is statistically significant at the p < 0.05 level.
- For a ratio (e.g., a relative risk or odds ratio): The "no effect" value is 1. If the 95% CI does not include 1, the result is statistically significant at the p < 0.05 level.
The Width of the CI:
The width of the CI tells you about the precision of your estimate.
- A narrow CI implies a precise estimate (usually from a large study).
- A wide CI implies an imprecise estimate (usually from a small study).
This makes CIs much more informative than p-values alone.
What are confidence intervals and p-values?
The article 'What are confidence intervals and p-values?' gives a very clear text-based explanation of CIs and provides a great real-world example of how to interpret them from a published study.
Please read the sections titled 'What are confidence intervals?', 'Assessing significance from a confidence interval', and 'Box 2. An example of the use of confidence intervals'. This will solidify your understanding of how to interpret a CI and use it to assess significance.
Test your understanding!
A research team studies the effect of Brahmi on memory, comparing a Brahmi group to a placebo group using a standardized memory score. The average score in the Brahmi group was 5 points higher than in the placebo group.
The results are reported in two different ways. Interpret each one.
- "The difference between the groups was 5 points (p = 0.02)."
- "The difference between the groups was 5 points (95% CI: 1.0 to 9.0)."
What does each statement tell you about the study's findings?
Show answer
- p = 0.02: Since the p-value (0.02) is less than the standard cutoff of 0.05, we can conclude that the result is statistically significant. We reject the null hypothesis and say that there is evidence that Brahmi has an effect on memory scores.
- 95% CI: 1.0 to 9.0: This interval gives us more information.
- Significance: The interval ranges from 1.0 to 9.0. Since this range does not include 0 (the value of "no difference"), we can confirm that the result is statistically significant, just as the p-value told us.
- Magnitude & Precision: The CI tells us that the true effect of Brahmi is likely somewhere between a 1-point and a 9-point improvement. This gives us a plausible range for the size of the effect. The width of the interval (8 points) gives us a sense of the estimate's precision.
Conclusion
Today, we have navigated the fundamental logic of modern clinical research. You now understand the formal process of asking a question, framing it as a testable hypothesis, and using data to make an evidence-based decision, all while being aware of the potential for error.
Key Takeaways:
- Hypothesis testing is a structured process that starts with a null hypothesis () of no effect. The goal is to collect evidence to reject .
- In this process, we can make a Type I error (false positive, probability ) or a Type II error (false negative, probability ).
- The p-value quantifies the evidence against . If p < (usually 0.05), we declare the result "statistically significant."
- Confidence Intervals (CIs) are more informative than p-values. They provide a range of plausible values for the true effect size and give insight into the precision of the estimate.
Preview of the Next Lesson:
We've learned the theory behind making a statistical conclusion. But how do we actually calculate a p-value or a confidence interval? The calculation depends on the type of data you have. In our next lesson, you will learn how to select an appropriate statistical test (e.g., t-test, chi-square test) for comparing two groups and interpret the results. This will bring the abstract concepts of today's lesson into the realm of practical application.