Hello! Welcome to your next lesson in the "Foundations of Clinical Research and Biostatistics" module.
In our last lesson, we explored the core logic of hypothesis testing. You learned about the null hypothesis, how to use p-values to gauge statistical significance, and the importance of confidence intervals. We established why we test hypotheses: to determine if an observed effect in a study is likely a real phenomenon or just a product of random chance.
Today, we move from the "why" to the "how." Our learning outcome is to select an appropriate statistical test (e.g., t-test, chi-square test) for comparing two groups and interpret the results. Think of this as learning to choose the right tool for a specific job. Just as an Ayurvedic practitioner selects a specific herb for a specific imbalance, a researcher must select the right statistical test for a specific research question and data type. This skill is fundamental to conducting and understanding scientific research on Ayurvedic interventions.
Part 1: The Three Questions for Choosing Your Test
You can't use a single statistical test for every situation. The correct choice depends on the structure of your research and the nature of the data you've collected. To navigate this, you need to answer three key questions.
A great way to start is by watching this overview, which connects the types of variables you have to the statistical question you're asking.
Statistics made easy ! ! ! Learn about the t-test, the chi square test, the p value and more
The video 'Statistics made easy ! ! !' by Global Health with Greg Martin provides a simple framework for thinking about which test to use based on the kind of data you are comparing.
Watch the section from the beginning to 01:54 to review the difference between categorical and numeric variables. Then, watch from 02:50 to 04:54, which provides an excellent map of how different combinations of variables lead to different statistical tests. Focus on the scenarios involving t-tests and chi-square tests.
As the video illustrates, the choice of test is a logical process. Let's formalize the key decision points.
Question 1: What is the type of your outcome variable?
In the last module, we differentiated between variable types. This is where that knowledge becomes critical. Is the main outcome you're measuring:
- Categorical? The data fits into distinct categories (e.g., disease status 'Yes/No', symptom improvement 'Mild/Moderate/Severe', Dosha type 'Vata/Pitta/Kapha').
- Numerical (or Continuous)? The data is a measurement on a scale (e.g., blood pressure in mmHg, cholesterol level in mg/dL, pain score from 1-10).
Question 2: Are the groups you are comparing independent or paired?
This relates to your study design.
- Independent (Unpaired) Groups: The two groups consist of different individuals who are not related to each other.
- Example: A study randomly assigns 50 people to receive Ashwagandha and 50 different people to receive a placebo. You are comparing the Ashwagandha group to the placebo group.
- Paired (or Related) Groups: The two sets of measurements come from the same individuals. This is common in "before-and-after" studies.
- Example: You measure the anxiety levels of 100 people, have them practice a breathing exercise for a month, and then measure their anxiety levels again. You are comparing the before measurements to the after measurements.
This distinction is crucial, and the following resource explains it well.
Choosing the Correct Statistical Test - PMC
The article 'Choosing the Correct Statistical Test' from the Indian Journal of Critical Care Medicine provides a concise explanation of the key factors in test selection. We will focus on the difference between paired and unpaired data.
Read the section titled 'Are the Comparisons Matched (Paired) or Unmatched (Unpaired)?' This short section clearly defines the difference with clinical examples.
Question 3 (for Numerical Data only): Is the data "normally distributed"?
This question leads to a choice between two families of tests:
- Parametric Tests (e.g., t-test): These are powerful tests, but they have assumptions. The main assumption is that your numerical data follows a bell-shaped curve known as a "normal distribution."
- Non-Parametric Tests (e.g., Mann-Whitney U test): These are used when the assumptions for parametric tests are not met, such as when data is skewed or the sample size is very small. They are generally less powerful but more versatile.
For now, you don't need to know how to test for normality yourself. Just be aware that this choice exists and that research papers should state which test they used and why.
Part 2: A Practical Guide to Common Tests for Two Groups
Now let's put these three questions into practice to build a decision-making flowchart. The following video provides a very structured walkthrough of this process. We will watch specific sections as we cover each scenario.
How to choose the correct statistical test - or how to tell the correct test has been used
The video 'How to choose the correct statistical test' from the school of surgery channel is an excellent, logical guide. It walks you through a decision tree, which we will use to select our tests.
Scenario A: Comparing Two INDEPENDENT Groups
You have two separate groups of subjects (e.g., Treatment vs. Placebo).
If your outcome is CATEGORICAL...
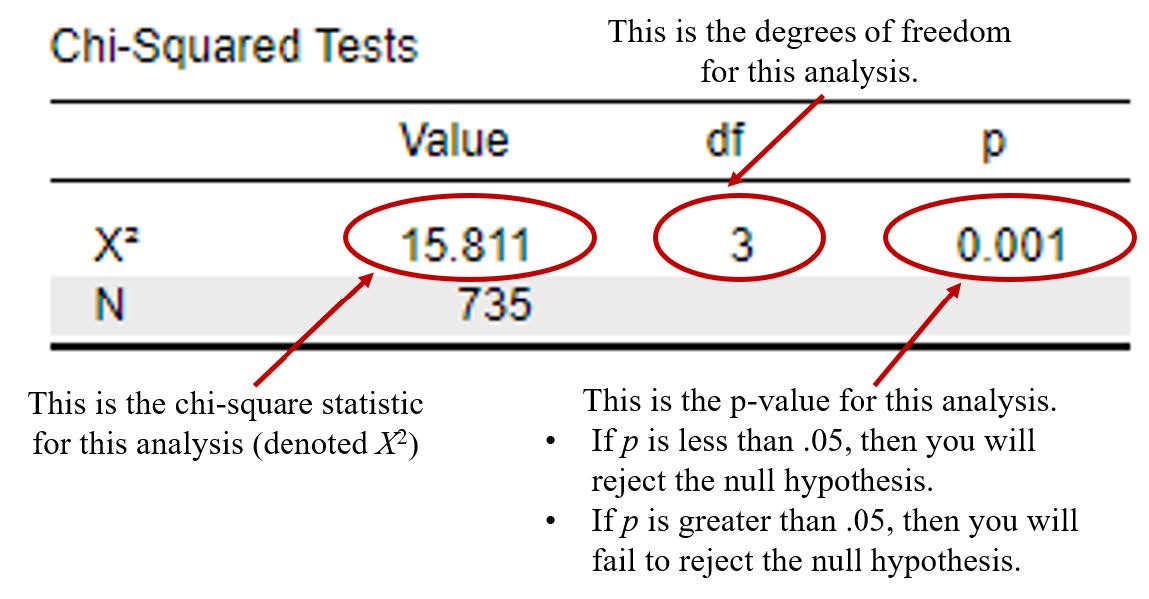
You use the Chi-Square () Test. This test compares the observed proportions of a category between the two groups to what we would expect if there were no real difference (i.e., if the null hypothesis were true).
- Ayurvedic Example: A researcher wants to know if a Triphala intervention improves constipation. They recruit 100 people with constipation, giving 50 Triphala and 50 a placebo. After one month, they record whether each patient's constipation is 'Improved' or 'Not Improved'. The Chi-Square test would determine if the proportion of improved patients in the Triphala group is significantly different from the proportion in the placebo group.
The Chi-Square test generates a p-value. Here’s how to interpret the output:
If your outcome is NUMERICAL...
Here, you need to consider normality (Question 3).
-
If the data is normally distributed, you use the Independent Samples t-test.
-
If the data is not normally distributed, you use its non-parametric equivalent, the Mann-Whitney U Test.
-
Ayurvedic Example: Imagine a study comparing the effect of a Vata-pacifying diet vs. a standard diet on sleep quality in two separate groups of people. Sleep quality is measured as the average hours of sleep per night (a numerical outcome). The independent t-test would be used to see if the mean hours of sleep in the two groups are significantly different.
The following video segment explains this choice clearly.
How to choose the correct statistical test - or how to tell the correct test has been used
Let's return to the 'school of surgery' video to see how to choose a test for comparing two independent groups with numerical data.
Watch from 13:09 to 16:17. This part walks you through the decision path for comparing two independent groups, explaining when to use the 'Independent T Test' versus the 'Man Whitney U test'.
Scenario B: Comparing Two PAIRED Groups
You have one group of subjects with "before" and "after" measurements.
If your outcome is CATEGORICAL...
You use McNemar's Test. It's designed specifically for this "before-and-after" scenario with a binary outcome (e.g., Yes/No, Present/Absent).
- Ayurvedic Example: A group of 50 individuals are diagnosed with 'Ama' (Present/Absent). They undergo a cleansing therapy (Shodhana). Afterwards, they are assessed again for the presence of 'Ama'. McNemar's test would determine if there was a significant change in the proportion of individuals with 'Ama' from before to after the therapy.
If your outcome is NUMERICAL...
-
If the differences between the before and after scores are normally distributed, you use the Paired t-test.
-
If the differences are not normally distributed, you use the Wilcoxon Signed-Rank Test.
-
Ayurvedic Example: A researcher measures the fasting blood sugar level of 30 pre-diabetic patients. The patients are then prescribed a specific yoga protocol for 3 months. After 3 months, their fasting blood sugar is measured again. A paired t-test would be used to determine if there was a statistically significant change in the mean blood sugar level.
This final clip from the video will guide you through this choice.
How to choose the correct statistical test - or how to tell the correct test has been used
Finally, let's see how the 'school of surgery' video handles the choice of test for paired groups.
Watch from 16:17 to 17:25. This section covers the path for two related (repeated measures) groups, explaining the choice between the 'Repeated measures T Test' (Paired t-test) and the 'Wilcoxon signed-rank test'.
Test your understanding!
For each research scenario, which statistical test would you choose?
- A study compares the mean C-reactive protein (CRP, a numerical marker of inflammation) levels between a group of people practicing meditation and a control group.
- A study evaluates a new herbal tea for insomnia. 30 participants record their sleep quality as 'Good' or 'Poor' for one week. They then drink the tea for a month and again record their sleep quality as 'Good' or 'Poor' for the final week. The study wants to see if the proportion of 'Good' sleep weeks changed.
- A study tests an Ayurvedic oil for joint pain. 40 patients with knee pain rate their pain on a 1-10 scale. After a month of applying the oil, they rate their pain again. The study wants to see if the mean pain score decreased.
Show answer
- Independent Samples t-test (or Mann-Whitney U): The outcome (CRP level) is numerical, and the groups (meditation vs. control) are independent.
- McNemar's Test: The outcome (sleep quality) is categorical ('Good'/'Poor'), and the measurements are paired (before vs. after the tea).
- Paired t-test (or Wilcoxon Signed-Rank): The outcome (pain score) is numerical, and the measurements are paired (before vs. after the oil).
Part 3: Interpreting Test Results in an Ayurvedic Study
Theory is one thing, but seeing it in practice is key. Let's look at a real research paper that investigates Ayurvedic interventions for dyslipidemia (imbalanced cholesterol and triglycerides).
A Comparative Study of 7 Ayurveda Interventions to Control Dyslipidemia using Meta-data
This paper, 'A Comparative Study of 7 Ayurveda Interventions...', is a perfect real-world example. It uses several of the tests we've just discussed. We'll focus on how they analyzed 'before-and-after' changes.
First, read the 'Data Analysis' paragraph. Notice how the authors explicitly state which tests they used. Then, look at Table 2, 'Comparison (BT vs. AT) of Treatment Effect – parameters of dyslipidemia'.
Let's break down what you just read:
-
Stating the Methods: In the 'Data Analysis' section, the authors state they used the "pair t-test (pre-post) to see the related change." This is exactly our Scenario B for numerical data! They are comparing lipid levels before treatment (BT) to after treatment (AT).
-
Interpreting the Results (Table 2):
- Find the row for the intervention "Musta Churna".
- Look at the column for "Tch" (Total Cholesterol). The table shows a -30.0c percent change.
- Look at the footnote at the bottom of the table. It says: "Pair t-test ... c p<0.001".
This is the crucial link. The 'c' is telling you the result of the paired t-test. Here is how you would state the conclusion for that specific finding:
"In the group of 30 patients who took Musta Churna for 60 days, the mean total cholesterol level decreased by 30% from baseline. This reduction was highly statistically significant (p < 0.001), indicating that this result is very unlikely to be due to random chance."
This single sentence demonstrates that you can select the correct test (by identifying what the researchers did) and interpret its result in the context of the study.
Conclusion
You have now built upon the foundational principles of hypothesis testing and learned the practical steps for selecting and interpreting the most common statistical tests used for comparing two groups. This is a major step towards being able to critically read a scientific paper and design your own research.
Key Takeaways:
- Choosing a statistical test is a logical process based on three questions:
- Is the outcome categorical or numerical?
- Are the groups independent or paired?
- (For numerical data) Is the distribution normal (parametric test) or skewed (non-parametric test)?
- For comparing two independent groups: Use a Chi-Square test for categorical data and an Independent t-test for numerical data.
- For comparing two paired (before-after) measurements: Use McNemar's test for categorical data and a Paired t-test for numerical data.
- Interpretation focuses on the p-value: if p < 0.05, you reject the null hypothesis and conclude there is a statistically significant difference or change.
Preview of the Next Lesson:
We saw that the Musta Churna intervention produced a "statistically significant" result. But how meaningful is a 30% reduction in cholesterol? Is it a small, medium, or large effect? In our next lesson, we will address this by learning to explain the importance of effect size in conjunction with statistical significance. This will help you distinguish between results that are merely statistically interesting and those that are truly clinically important.