Hello! Welcome to your third lesson in the "Foundations of Clinical Research and Biostatistics" module.
In our last session, we explored the hierarchy of evidence, understanding that different study designs—from case reports to randomized controlled trials (RCTs)—offer varying levels of certainty. We touched upon the idea that the entire hierarchy is designed to minimize errors that can lead us to the wrong conclusions. Today, we will dive deep into two of the most significant sources of error: bias and confounding.
Your learning outcome for this lesson is to: Explain the concepts of bias and confounding and describe methods to control for them in study design and analysis.
Mastering this topic is absolutely critical for your goal of bridging Ayurveda and modern science. When you read a study on a medicinal herb or evaluate a traditional therapy, you need to be able to determine if the reported effects are real or if they are simply the result of flawed methodology. This lesson will give you the tools to become a more critical and discerning reader of scientific literature.
What is Bias? A Systematic Problem
In research, an "error" can be random or systematic.
- Random Error (Chance): This is the variability that happens by chance. If you flip a coin 10 times, you might get 7 heads just by luck. It's unpredictable and can usually be reduced by increasing the study size.
- Systematic Error (Bias): This is different. Bias is a flaw in the study's design, conduct, or analysis that causes the results to be consistently distorted in one direction. It's like using a faulty scale that always adds 2 kilograms; no matter how many times you weigh yourself, the reading will always be systematically wrong. Increasing the study size will not fix bias.
Let's begin by watching a short video that introduces the concept of bias as a systematic error.
How Medical Research Gets It Wrong (Medical Bias Part 1)
The video 'How Medical Research Gets It Wrong' from the Medlife Crisis channel provides an accessible definition of bias and why it's a pervasive problem in research.
Watch from 00:48 to 01:37. Focus on the definition of bias as a 'systematic error' and the idea that good research aims to minimize it.
For a more structured overview, let's explore a textbook definition and the main categories of bias.
The article 'Biases and Confounding' from Health Knowledge provides a formal definition of bias and groups the many types into two main categories: information bias and selection bias.
Read the section titled 'Bias in Epidemiological Studies' up to and including the paragraph defining 'Information bias'. This will solidify the definition and introduce the two main types we will discuss.
1. Selection Bias
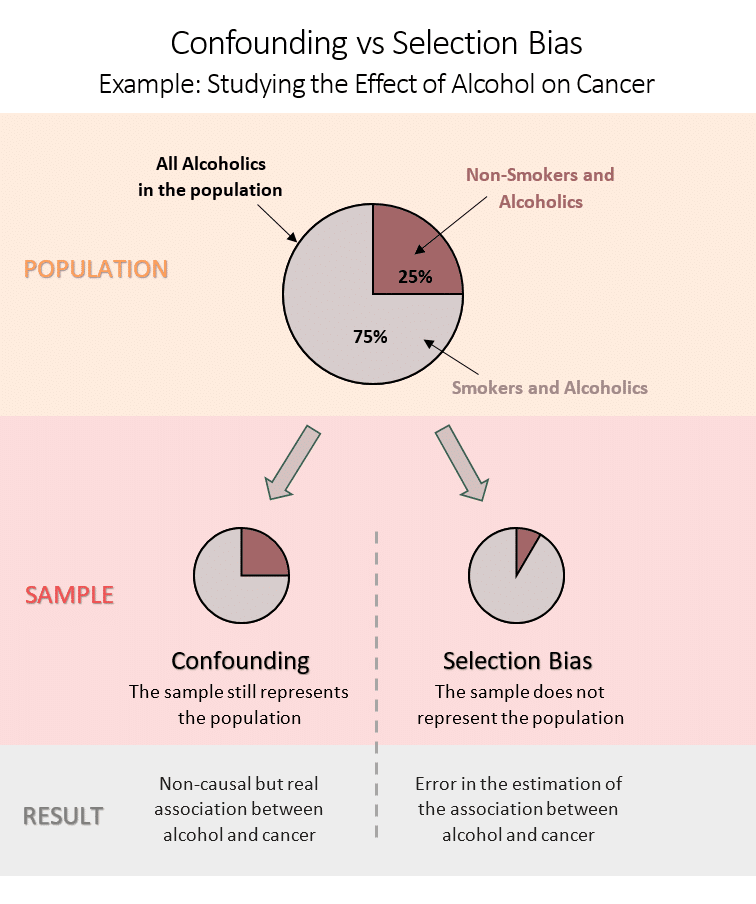
Selection bias occurs when there are systematic differences between the people who are included in a study versus those who are not, or between the different groups being compared within a study. This means your study sample is not representative, and the results may not be accurate.
Let's look at a few key types:
- Sampling Bias: Occurs when some members of the target population are more likely to be selected than others. For example, if you are studying the effects of a traditional Ayurvedic diet on the general population but you recruit participants only from a high-end wellness retreat, your sample will likely be wealthier and more health-conscious than the general population, biasing your results.
- Allocation Bias: In an experimental study, this happens when the process of assigning participants to treatment or control groups is not random, leading to systematic differences between the groups from the start. For example, a clinician might subconsciously assign sicker patients to a new, promising treatment, making it harder to know if the treatment is truly effective.
- Attrition Bias: This happens when participants who drop out of a study are systematically different from those who remain. Imagine a study on a new herbal formulation with unpleasant side effects. If many people in the treatment group drop out because of these effects, and you only analyze the people who finished the study, you might wrongly conclude the herb is well-tolerated.
2. Information Bias (or Measurement Bias)
Information bias occurs when the information collected from study participants is systematically inaccurate or different between groups.
Here are some common types:
- Recall Bias: A major problem in case-control studies. People with a disease ("cases") may remember their past exposures differently than people without the disease ("controls"). For instance, a mother of a child with a birth defect might search her memory more thoroughly for any potential exposures during pregnancy compared to a mother of a healthy child.
- Observer Bias (or Detection Bias): This happens when the investigator's knowledge of a participant's group allocation influences how they measure or record the outcome. If a researcher believes a certain rasayana improves vitality, they might subconsciously score the vitality markers of the treatment group more favorably.
- Interviewer Bias: An interviewer might ask questions in a leading way, influencing responses. For example: "You've been feeling much more energetic since starting the treatment, haven't you?"
The following video provides clear examples of these major bias types and, importantly, how to control them.
The video 'Confounding, chance, and bias' from Cochrane Austria clearly explains the key types of bias encountered in interventional studies.
Watch from 04:58 to 08:49. Pay close attention to the four types of bias discussed (selection, performance, measurement, and attrition) and the methods mentioned to prevent them, such as randomization and blinding.
Key methods for controlling bias are implemented at the study design stage:
- Randomization and Allocation Concealment: The best defense against selection bias in RCTs.
- Blinding (or Masking): The best defense against information and performance biases. If participants, clinicians, and outcome assessors don't know who is in which group, their expectations cannot influence the results.
What is Confounding? The "Third Variable" Problem
Confounding is different from bias. It's not an error made by the researcher; it's a real relationship that exists in the population that can mislead you if you don't account for it. Confounding occurs when a third variable, the confounder, is associated with both the exposure you're studying and the outcome you're measuring, creating a false association between them.
A variable is a confounder if it meets three conditions:
- It is associated with the exposure.
- It is an independent risk factor for the outcome.
- It is not on the causal pathway between the exposure and the outcome.
The classic example is the observed link between coffee drinking (exposure) and heart disease (outcome). Smoking is a confounder here:
- Smokers tend to drink more coffee (associated with exposure).
- Smoking causes heart disease, regardless of coffee intake (independent risk factor for outcome).
- Coffee drinking does not cause smoking (not on the causal pathway).
The observed association between coffee and heart disease might be partially or entirely due to the effect of smoking.
Let's watch a video that explains confounding with a famous real-world example.
How Medical Research Gets It Wrong (Medical Bias Part 1)
Continuing with the Medlife Crisis video, this segment explains confounding using the memorable and important historical example of hormone replacement therapy (HRT) and heart disease.
Watch from 06:18 to 09:21. Focus on understanding the 'mixing of effects' and how an unmeasured factor (socioeconomic status and overall health) led to a completely wrong conclusion in early observational studies.
Distinguishing Bias and Confounding
- Bias is a result of researcher error in design or conduct. It creates an association that isn't real. The primary fix is a good study design.
- Confounding is a real association with a third variable that is "mixed in" with the exposure-outcome relationship. It can be handled in both the study design and the analysis.
Controlling for Confounding
We can manage confounding in two main ways: during the study design or during the data analysis.
At the Design Stage
- Randomization: The most powerful method. In a large enough RCT, randomization ensures that all potential confounders, both those we know about and those we don't, are distributed evenly between the treatment and control groups.
- Restriction: You can restrict your study population to eliminate a confounder. For example, if you are worried smoking is a confounder, you could conduct your study only on non-smokers. The downside is that your results are no longer generalizable to smokers.
- Matching: Used mainly in case-control studies. For each "case," you select one or more "controls" who are similar in terms of the potential confounders (e.g., same age, sex, smoking status).
At the Analysis Stage
If you can't control for confounding in the design (as is often the case in observational studies), you can adjust for it in the analysis, provided you have measured the potential confounders.
- Stratification: You analyze the data in separate subgroups (strata) based on the confounder. Let's look at a brilliant, practical example of this.
Assessing bias: the importance of considering confounding
The article 'Assessing bias: the importance of considering confounding' by Skelly et al. provides a fantastic, step-by-step example of how confounding can create a false association and how stratification can reveal the truth.
First, read the sections 'What is confounding?' and the example in 'How does confounding influence results?'. Follow the tables to see how a crude analysis suggested a treatment was harmful, but after stratifying by smoking status, the true (null) effect was revealed. Then, skim the section 'Dealing with confounding' to see a summary of the steps.
- Multivariable Analysis: This is a statistical method (like multiple regression) that allows you to mathematically adjust for many confounding variables at the same time. It's the most common and powerful method used in modern research to handle confounding at the analysis stage.
Test your understanding!
Imagine you are designing a study to see if a specific Ayurvedic practice, Shirodhara, reduces anxiety. You plan to conduct an observational study comparing 100 people who regularly receive Shirodhara from a local clinic with 100 people from the general community who do not. You find that the Shirodhara group has significantly lower anxiety scores.
- Identify one major potential confounder in this study. Explain why it fits the three criteria of a confounder.
- Identify one potential source of bias in this study.
- What study design would be a better way to test the effectiveness of Shirodhara and why?
Show answer
-
Confounder: A likely confounder is socioeconomic status or disposable income.
- Associated with exposure: People with higher income are more likely to be able to afford regular Shirodhara treatments.
- Independent risk factor for outcome: People with lower income often experience higher levels of stress and anxiety due to financial pressures, job insecurity, etc., independent of whether they get Shirodhara.
- Not on the causal pathway: Getting Shirodhara does not cause a change in your income.
Thus, the lower anxiety in the Shirodhara group might just be because they are, on average, wealthier and have less life stress, not because of the treatment itself.
-
Bias: A likely source is selection bias (specifically, self-selection or volunteer bias). The people who choose to get Shirodhara are likely different from the general population in ways related to anxiety. They may be more proactive about their mental health, more likely to engage in other stress-reducing activities (like meditation or yoga), or have a pre-existing belief in the effectiveness of Ayurvedic therapies, all of which could influence their anxiety levels.
-
Better Design: A Randomized Controlled Trial (RCT) would be far better. You would recruit a group of people with anxiety and randomly assign them to either a group that receives real Shirodhara or a control group (e.g., that receives a "sham" Shirodhara or simply lies down in a quiet room). Randomization would help ensure that confounders (like income, belief in Ayurveda, etc.) are balanced between the two groups. Blinding the outcome assessor to the group allocation would prevent observer bias. This way, any difference in anxiety between the groups could be more confidently attributed to the Shirodhara itself.
Conclusion
Today we've unpacked the critical concepts of bias and confounding, two major threats to the validity of research findings. Understanding them moves you from being a passive consumer of research to an active, critical appraiser.
Key Takeaways:
- Bias is a systematic error introduced by the researcher during the design or conduct of a study. The main types are selection bias (problems with who gets into the study) and information bias (problems with how data is collected).
- Bias is best prevented by careful study design, primarily through randomization and blinding.
- Confounding is a "mixing of effects" where a third variable is associated with both the exposure and the outcome, distorting their true relationship.
- Confounding can be controlled at the design stage (randomization, restriction, matching) or at the analysis stage (stratification, multivariable analysis).
- When evaluating any study, especially observational ones, always ask: "Could the results be explained by bias or confounding?"
Preview of the Next Lesson:
Now that we understand how to design studies to collect valid data, our next step is to learn how to describe that data. In the next lesson, we will move on to the first step of data analysis: "Distinguish between categorical and continuous variables and calculate appropriate descriptive statistics for each." This will lay the groundwork for understanding the statistical tests used to analyze research results.