Hello! Welcome to your second lesson in the "Fundamentals of Modern Pharmacology" module.
In our last lesson, we traced the journey of a drug through the body using the ADME framework—Absorption, Distribution, Metabolism, and Excretion. We established a qualitative understanding of "what the body does to a drug" and drew parallels to Ayurvedic concepts of digestion (Agni) and waste elimination (Mala).
Today, we will build upon that foundation by learning how to quantify this journey. Our learning outcome is to explain key pharmacokinetic parameters including bioavailability, half-life, and the therapeutic window. These parameters are not just abstract numbers; they are the practical tools that allow scientists and clinicians to design dosing regimens that are both safe and effective. Understanding them is a critical step in your goal of bridging Ayurvedic principles with the rigors of modern medical science.
1. Bioavailability (F): How Much of the Drug Reaches the Bloodstream?
In the last lesson, we learned that absorption is the process of a drug moving from its administration site into the blood. Bioavailability takes this a step further by quantifying it. It is defined as the fraction or percentage of an administered drug that reaches the systemic circulation in an unchanged form.
A drug given intravenously (IV) has a bioavailability of 100% by definition because it's injected directly into the bloodstream. However, for a drug taken orally, the journey is more complex. It must be absorbed from the gut and then pass through the liver before reaching the rest of the body. This is where the first-pass effect (or first-pass metabolism) comes into play, which we introduced last time. The liver can metabolize a significant portion of the drug, reducing the amount that ultimately reaches the systemic circulation.
To visualize this, let's watch a short, clear animation.
Pharmacokinetics part 1: Overview, Absorption and Bioavailability, Animation
This clip from Alila Medical Media clearly defines bioavailability and explains why it differs between intravenous and oral routes. It also introduces how it's calculated.
Please watch the segment from 04:45 to 06:41. Pay close attention to the visual comparison of the plasma concentration curves for IV versus oral administration.
As the video explained, bioavailability is often represented by the letter F. An F value of 1 (or 100%) means complete bioavailability, while an F value of 0.5 (or 50%) means only half of the administered dose reaches the bloodstream.
This concept has a strong resonance with the Ayurvedic principle of Vipaka, or the post-digestive effect of a substance. Before a substance can exert its systemic effects on the Dhatus (tissues), it is first transformed by Jatharagni (digestive fire) in the gut and then further processed by the liver (Yakrit). A drug with low oral bioavailability is, in a modern sense, a substance that undergoes a very strong "first pass" transformation, altering its potency before it circulates widely.
Measuring Bioavailability: Area Under the Curve (AUC)
How do we calculate bioavailability? As the video mentioned, we use the Area Under the Curve (AUC) from a plasma concentration-time graph. The AUC represents the total exposure of the body to the drug over time.
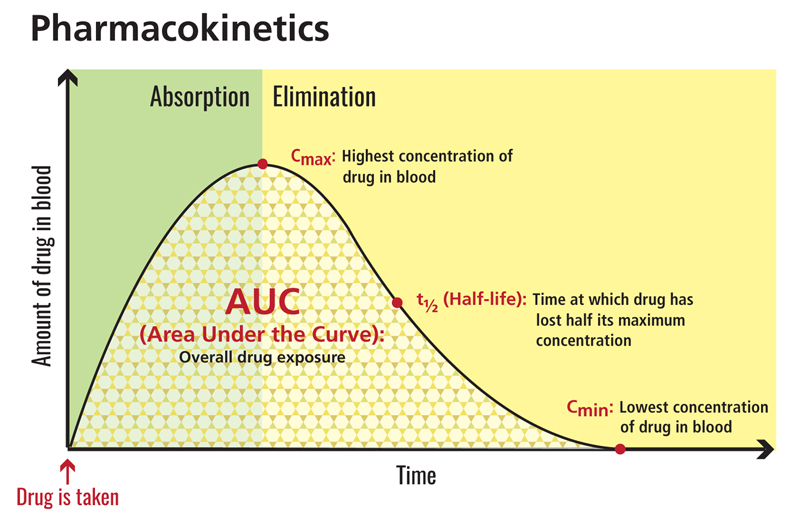
To calculate the bioavailability (F) of an oral drug, we compare its AUC to the AUC of the same drug given intravenously:
This tells us exactly what percentage of the oral dose made it into the systemic circulation compared to the 100% bioavailable IV dose.
2. Half-Life (t½): How Long Does the Drug Last?
Once a drug is in the body, it begins to be eliminated. The half-life (t½) is one of the most important pharmacokinetic parameters. It is defined as the time required for the concentration of the drug in the body (usually measured in the plasma) to be reduced by half.
This rate of elimination is crucial because it determines how long a drug's effect will last and how often it needs to be administered.
Dr. John Campbell provides a very clear, step-by-step explanation of this concept.
Applied Pharmacology 4, Half Life of Drugs
In his video 'Applied Pharmacology 4, Half Life of Drugs,' Dr. Campbell uses a simple graph to demonstrate the concept of half-life and first-order kinetics, where a constant fraction of the drug is eliminated over time.
Please watch the segment from 04:19 to 12:32. Follow his example of a drug with an initial dose of 100mg and observe how the amount decreases by half with each successive half-life period.
As you saw, if a drug has a half-life of 2 hours:
- After 2 hours (1 half-life), 50% of the drug remains.
- After 4 hours (2 half-lives), 25% remains.
- After 6 hours (3 half-lives), 12.5% remains.
...and so on.
A rule of thumb in pharmacology is that a drug is considered effectively eliminated from the body after about five half-lives, at which point only about 3% of the original dose remains.
Half-Life, Dosing Frequency, and Steady State
The half-life of a drug directly dictates its dosing schedule.
- Short half-life (e.g., 2-4 hours): The drug is eliminated quickly and needs to be given more frequently (e.g., every 4-6 hours) to maintain its effect.
- Long half-life (e.g., 24 hours or more): The drug is eliminated slowly and can be given just once a day.
When a drug is given repeatedly, the goal is often to achieve steady state.
Chapter 1 Pharmacokinetics & Pharmacodynamics
To reinforce this idea, let's read a concise explanation of half-life and steady state from a pharmacology text.
Please read the subsections titled 'HALF LIFE' and 'Duration, Dosing, and Steady State'. These sections clearly define half-life and explain its direct relationship to dosing frequency and the achievement of steady state.
As the text explains, steady state is the point at which the amount of drug entering the body is equal to the amount being eliminated. This results in a stable, constant plasma concentration, which is usually necessary for an optimal and continuous therapeutic effect. It typically takes about 4 to 5 half-lives to reach steady state with regular dosing.
3. Therapeutic Window: Is the Dose Safe and Effective?
We now know how to quantify how much drug gets in and how long it stays. But what is the right concentration to aim for? This is where the therapeutic window comes in.
The therapeutic window (also called the therapeutic range) is the range of drug concentrations that produces the desired therapeutic effect without causing significant toxicity.

A drug has a wide therapeutic window if there is a large difference between the effective dose and the toxic dose. These drugs are generally considered safer. In contrast, a drug with a narrow therapeutic window has a small difference between its effective and toxic doses, meaning it must be administered with great care to avoid toxicity.
To see this in a clinical context, let's look at a classic example.
Chapter 1 Pharmacokinetics & Pharmacodynamics
The NCBI text we used earlier provides an excellent explanation of the therapeutic window using the example of warfarin, an anticoagulant (blood thinner).
Please read the subsections 'Therapeutic Window' and 'Therapeutic Index'. Note the graph showing the therapeutic window for warfarin and how it relates to bleeding or clotting risk. The concept of the therapeutic index is a quantitative measure of this window.
As you read, the therapeutic index (TI) is a ratio that compares the toxic dose to the effective dose. A higher TI signifies a safer drug. Drugs with a low TI (a narrow therapeutic window) like warfarin, digoxin, and certain antibiotics often require regular blood tests to ensure the patient's drug levels are within the safe and effective range.
The ultimate goal of applying pharmacokinetic principles is to design a dosing regimen (dose, route, and frequency) that maintains the plasma concentration of a drug consistently within its therapeutic window.
Test your understanding!
You are comparing two hypothetical drugs for treating the same condition.
- Drug A: Has a half-life of 24 hours and a wide therapeutic window.
- Drug B: Has a half-life of 3 hours and a narrow therapeutic window.
Based on these parameters, which drug would likely be easier and safer for a patient to take? Why? Consider dosing frequency and the risk of adverse effects.
Show answer
Drug A would be much easier and safer.
- Dosing Frequency: With a long half-life of 24 hours, Drug A would likely be taken just once a day, which is more convenient for the patient. Drug B, with a short 3-hour half-life, would need to be taken multiple times a day (e.g., every 4-6 hours) to maintain its effect.
- Safety: Drug A's wide therapeutic window means that minor variations in its plasma concentration are unlikely to cause toxicity or loss of effect. Drug B's narrow therapeutic window makes it riskier; a small dosing error or a change in the patient's ability to eliminate the drug could easily push the concentration into the toxic range or let it fall below the effective level. Drug B would require much more careful dosing and likely regular monitoring.
Conclusion
Today, we have moved from a descriptive to a quantitative understanding of pharmacokinetics. These parameters are the language of modern pharmacology, enabling the precise and safe use of medicines.
Key Takeaways:
- Bioavailability (F) tells us the fraction of a drug that reaches the bloodstream, heavily influenced by the route of administration and the first-pass effect.
- Half-Life (t½) measures how quickly a drug is eliminated from the body, which dictates the dosing frequency and the time required to reach a steady state.
- The Therapeutic Window defines the safe and effective concentration range for a drug. The goal of a dosing regimen is to keep the drug's concentration within this window.
By understanding these three concepts, you have gained insight into the core logic behind modern drug dosing. This quantitative approach is a powerful complement to the qualitative and holistic understanding of substance action in Ayurveda.
Preview of the Next Lesson:
We have now spent two lessons on pharmacokinetics—what the body does to the drug. In our next lesson, we will pivot to the other major branch of pharmacology: pharmacodynamics. We will begin to answer the question, "What does the drug do to the body?" by exploring dose-response relationships, including concepts like potency (ED50) and efficacy (Emax). This will bring us one step closer to understanding the mechanisms of drug action at a cellular level.