Hello! Welcome to the third lesson in our module on the Fundamentals of Modern Pharmacology.
In our previous two lessons, we focused on pharmacokinetics—what the body does to a drug. We traced the drug's journey through Absorption, Distribution, Metabolism, and Excretion (ADME) and quantified it using parameters like bioavailability and half-life.
Today, we shift our focus to the other side of the coin: pharmacodynamics, which addresses the question, "What does the drug do to the body?" This is where we begin to quantify the actual effects of a substance. Our goal is to define pharmacodynamics and explain dose-response relationships, including potency (ED50) and efficacy (Emax).
Understanding these concepts is fundamental to your goal of bridging Ayurveda and modern science. While Ayurveda describes the actions of a substance through qualities like Virya (potency) and Prabhava (specific, unique action), pharmacodynamics provides the modern scientific framework and language to measure and compare these actions with precision.
1. What is Pharmacodynamics?
Simply put, pharmacodynamics is the study of a drug's biochemical and physiological effects on the body. It explores the relationship between the concentration of a drug and the magnitude of the response it produces.
To get started, let's watch a brief introductory clip that sets the stage.
Dose-Response Relationship - Pharmacodynamics Lecture | Potency, Efficacy, Therapeutic Index etc
This video from Nonstop Neuron provides a clear definition of pharmacodynamics and introduces the core concept we will be studying today: the dose-response relationship.
Please watch from the beginning until 02:22. The video will clearly distinguish pharmacodynamics from pharmacokinetics and set up the dose-response relationship.
As the video highlighted, while we often talk about the "dose" causing a response, it's more accurate to think of the dose leading to a certain plasma concentration, which in turn produces the response. Since we've already covered the dose-to-concentration part in pharmacokinetics, today we will focus on the concentration-to-response relationship.
2. The Dose-Response Curve: Visualizing a Drug's Effect
The cornerstone of pharmacodynamics is the dose-response curve (DRC). This graph plots the dose of a drug against the magnitude of the resulting effect. Understanding how to create and interpret this curve is essential.
The relationship between dose and response is not linear. To make the data easier to work with, pharmacologists transform the graph by plotting the logarithm of the dose on the x-axis. Let's see why this is done and what the resulting curve looks like.
Dose-Response Relationship - Pharmacodynamics Lecture | Potency, Efficacy, Therapeutic Index etc
The same Nonstop Neuron video has an excellent section that explains how the dose-response curve is constructed and why a logarithmic scale is used.
Please watch from 02:22 to 10:36. Pay close attention to why the initial hyperbolic curve is transformed into a sigmoidal (S-shaped) curve and the advantages of doing so for analysis.
As you saw, the log dose-response curve has a characteristic S-shape. This sigmoidal curve is the standard tool we will use to derive two critical parameters: efficacy and potency.
3. Efficacy and Potency: The Two Key Characteristics of a Drug
Efficacy and potency are two of the most important—and often confused—terms in pharmacology. They describe different aspects of a drug's action and are independent of each other.
To get precise definitions, let's turn to a concise written resource.
Basic Principles of Pharmacodynamics
This article from the 'Pharmwiki' at Tulane University School of Medicine clearly defines and illustrates potency and efficacy.
Please read the sections titled 'The Dose Response Relationship' and 'Agonists'. Focus on the definitions of 'Potency' and 'Efficacy' and look closely at Figures 3 and 4, which illustrate these concepts graphically.
Let's break down and solidify these concepts:
Efficacy (Emax)
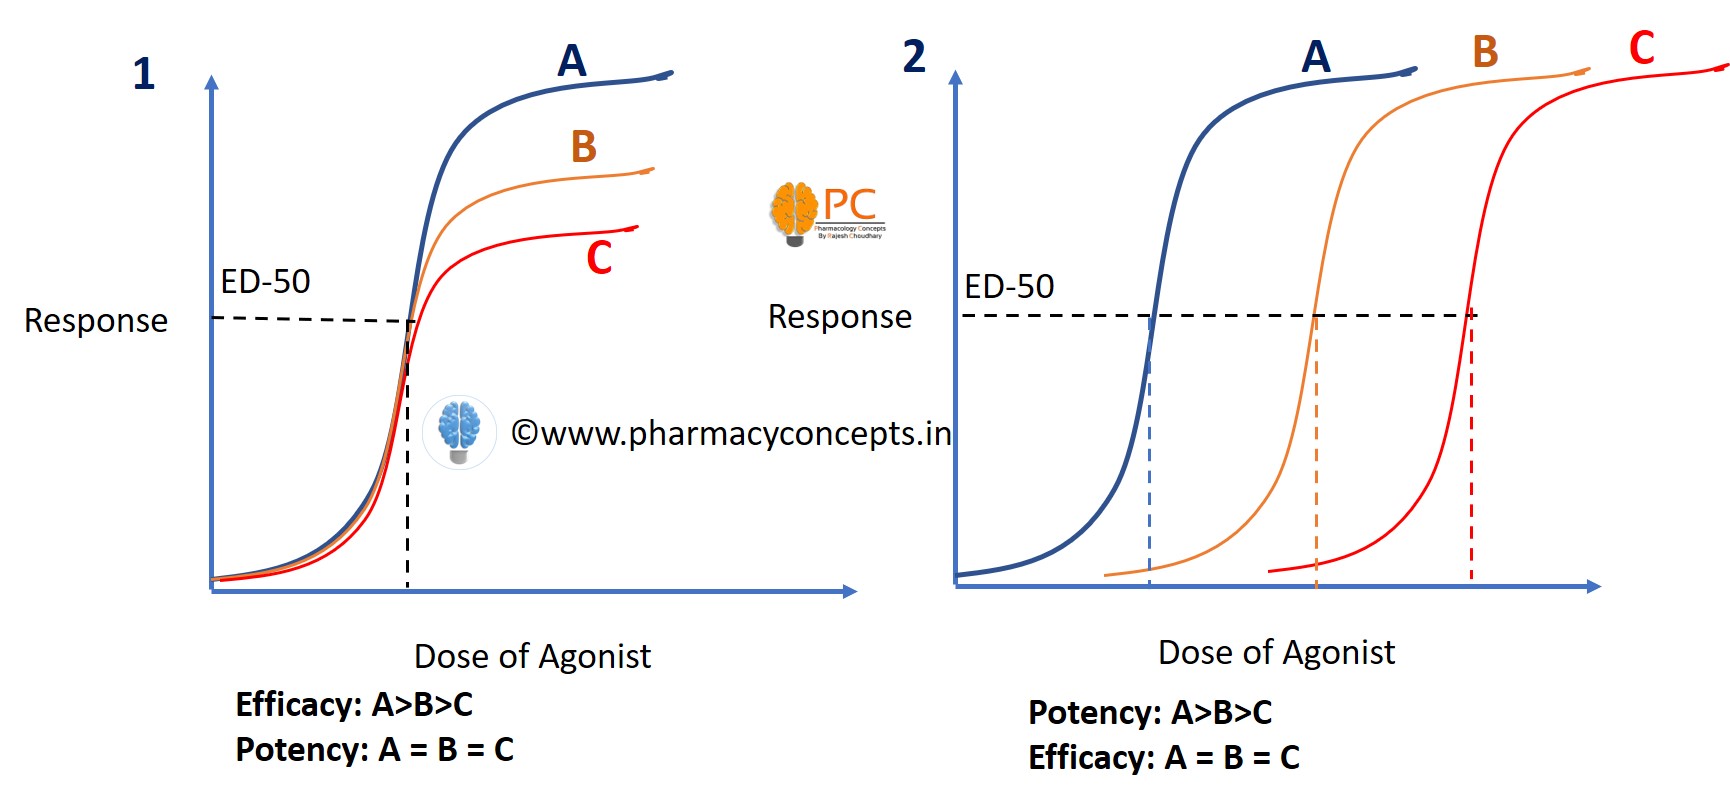
- Definition: Efficacy is the maximum response a drug is capable of producing. On the dose-response curve, it is the plateau, or the highest point on the y-axis.
- What it tells us: It measures the magnitude of the effect. A drug with higher efficacy can produce a greater therapeutic effect than a drug with lower efficacy, regardless of the dose.
- Clinical Relevance: Efficacy is often more clinically important than potency. For a patient with severe pain, a highly efficacious analgesic (like morphine) is needed, even if it requires a larger dose than a less efficacious one (like aspirin). The goal is to achieve the necessary level of pain relief, and aspirin simply cannot produce the same maximal effect as morphine.
Potency (ED50 or EC50)
- Definition: Potency refers to the amount of drug required to produce an effect of a given intensity. It is commonly measured by the ED50 (or EC50), which is the dose or concentration needed to produce 50% of the drug's own maximal effect.
- What it tells us: It measures the dose-efficiency of a drug. On the dose-response curve, potency is represented by the position of the curve along the x-axis. The further to the left the curve is, the more potent the drug (i.e., a lower dose is needed).
- A Note on Terminology:
- EC50 (Effective Concentration 50%) is used for in vitro studies where the drug concentration in a tissue bath is known precisely.
- ED50 (Effective Dose 50%) is used for in vivo studies in whole organisms (animals or humans), where a specific dose is administered.
Potency and efficacy are independent. A very potent drug (low ED50) can have low efficacy (low Emax), and vice versa.
4. Comparing Drugs: Efficacy vs. Potency in Action
Let's visualize this crucial distinction.
Now, let's look at a real-world clinical example with common pain medications.
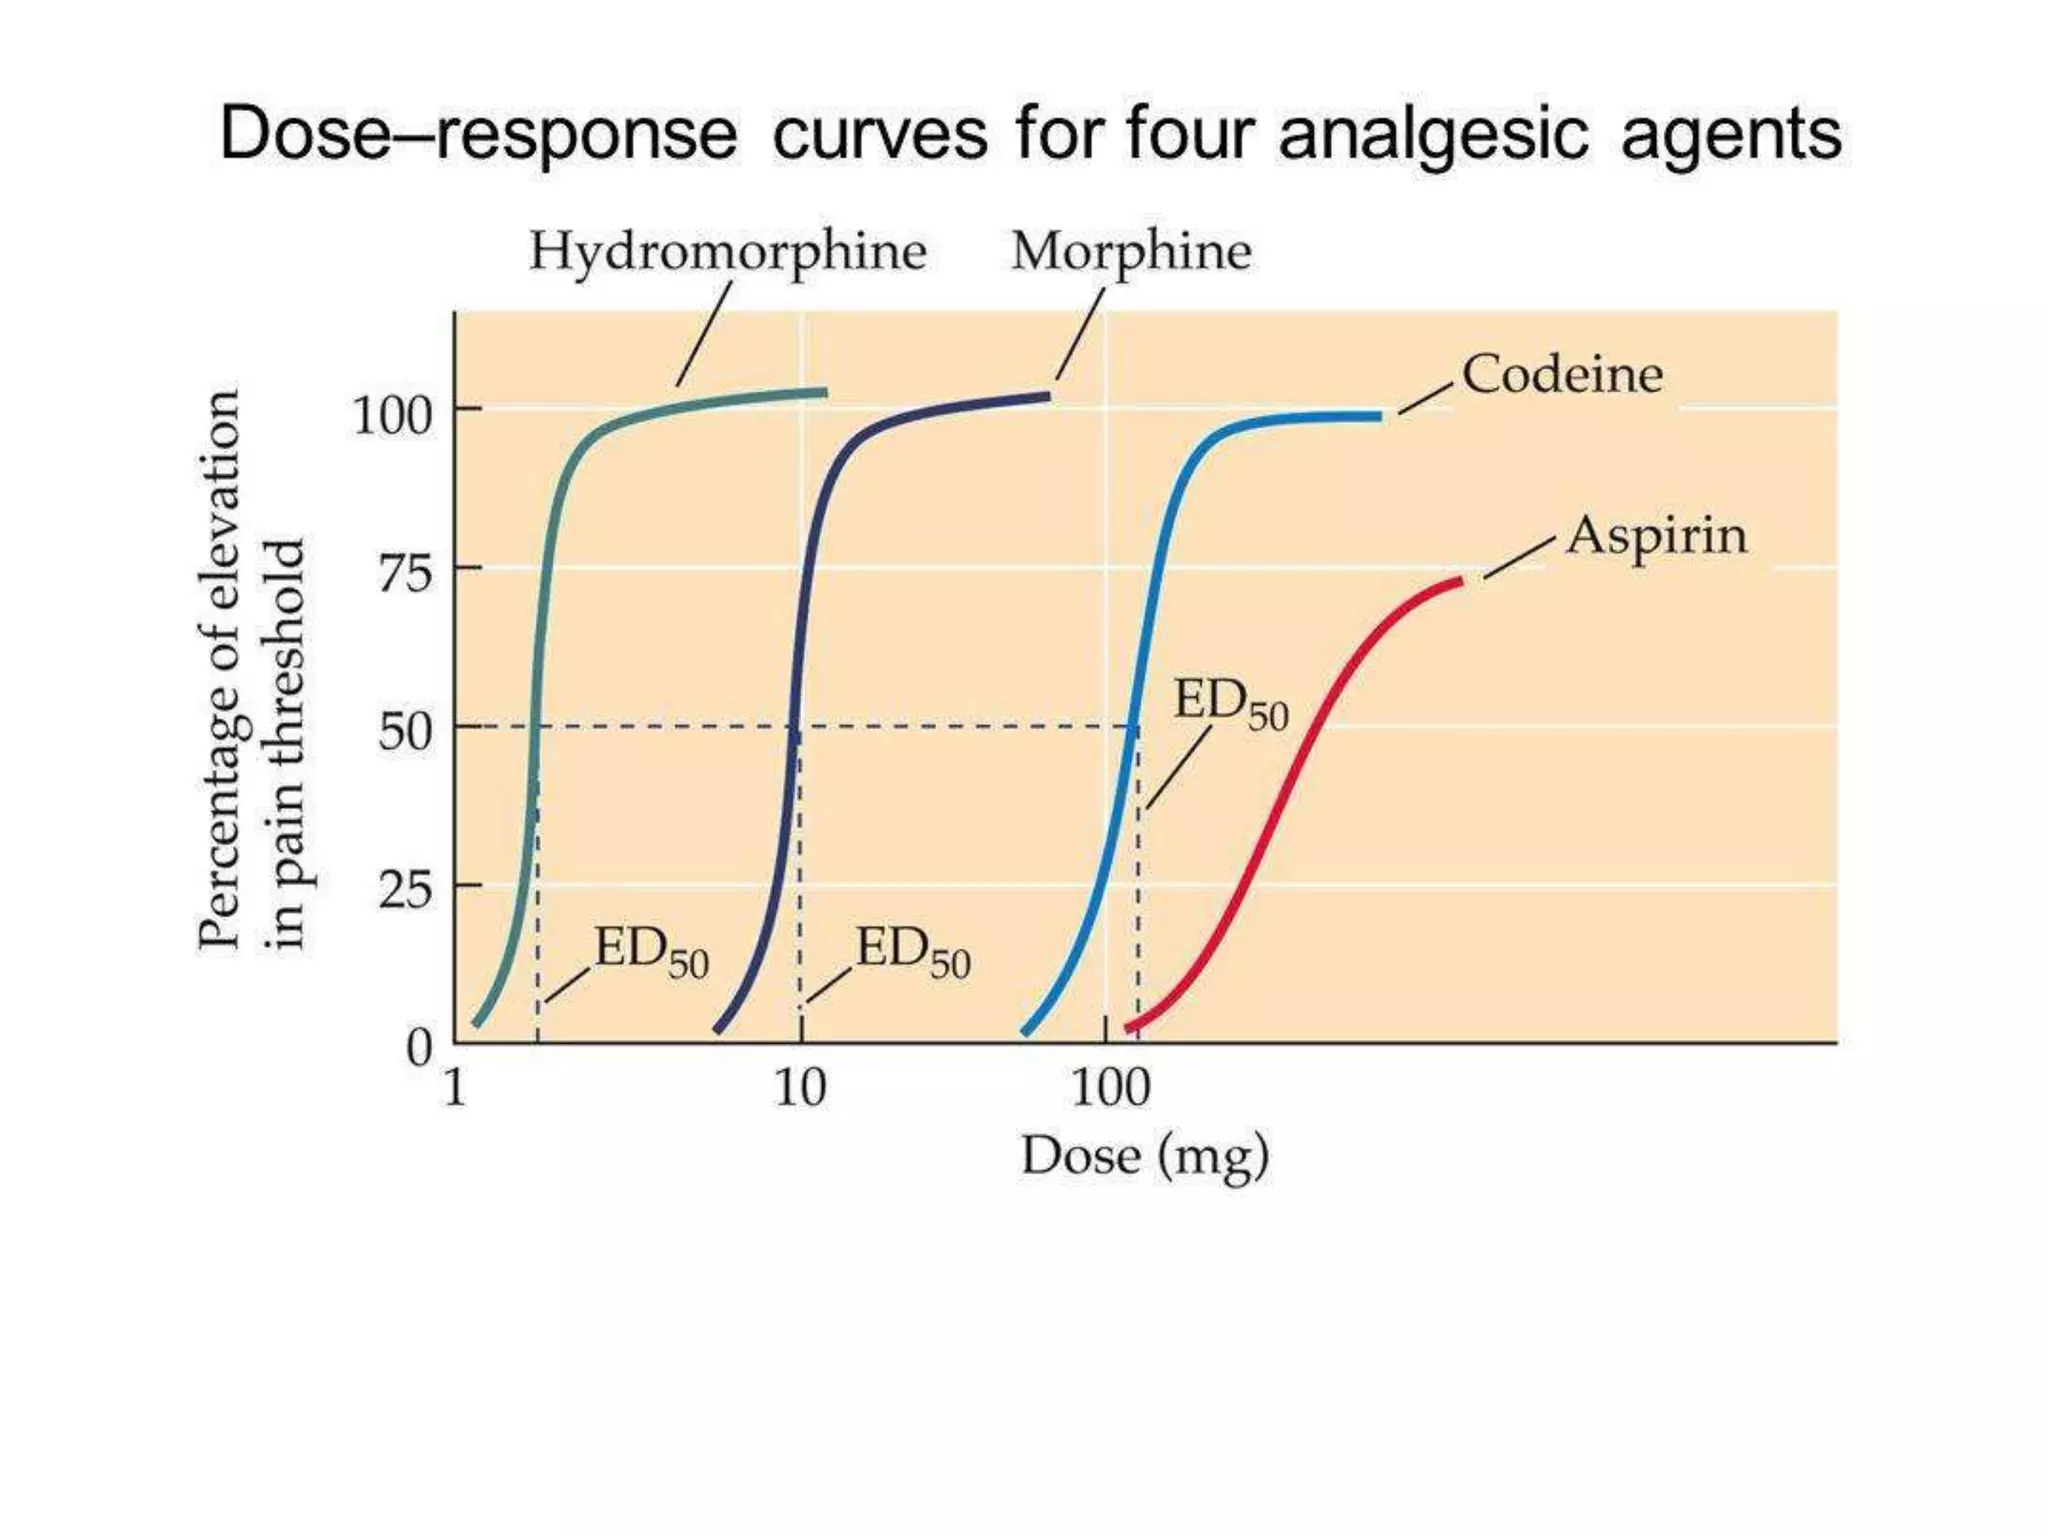
Let's analyze this graph together:
- Efficacy: Hydromorphone, Morphine, and Codeine all reach the same maximal effect (100% elevation in pain threshold). They have equal efficacy. Aspirin, however, plateaus at a much lower level, meaning it has lower efficacy. No matter how much aspirin you take, it can never produce the same degree of pain relief as morphine.
- Potency: Look at the ED50 values (the dose required to reach 50% effect). Hydromorphone is the most potent, as its curve is furthest to the left. Morphine is less potent than hydromorphone, and codeine is even less potent. Aspirin is the least potent of all. This means you need a much smaller dose of hydromorphone to get the same effect as a larger dose of morphine.
Test your understanding!
Imagine you are developing a new herbal treatment. You test two different formulations, Herbal Prep A and Herbal Prep B, for their ability to reduce inflammation. You generate the following dose-response curves.
- Herbal Prep A: ED50 = 10 mg; Emax = 40% inflammation reduction.
- Herbal Prep B: ED50 = 50 mg; Emax = 80% inflammation reduction.
Which preparation is more potent? Which is more efficacious? Which would you choose for a patient with severe inflammation?
Show answer
- Potency: Herbal Prep A is more potent. It requires a much lower dose (10 mg) to achieve 50% of its maximal effect compared to Prep B (50 mg).
- Efficacy: Herbal Prep B is more efficacious. Its maximal effect is an 80% reduction in inflammation, which is double that of Prep A (40%).
- Clinical Choice: For severe inflammation, you would choose Herbal Prep B. Even though it is less potent and requires a higher dose, its superior efficacy means it can provide a much greater degree of therapeutic relief that Prep A simply cannot achieve.
Conclusion
Today we have defined the fundamental principles of pharmacodynamics. We have moved from simply knowing a drug is in the body (pharmacokinetics) to quantifying what it actually does.
Key Takeaways:
- Pharmacodynamics is the study of what drugs do to the body, focusing on the relationship between drug concentration and effect.
- The log dose-response curve is a sigmoidal (S-shaped) graph that is the standard tool for visualizing and comparing drug effects.
- Efficacy (Emax) is the maximum possible effect a drug can produce. It is a measure of the magnitude of the effect and is indicated by the height of the curve.
- Potency (ED50) is the amount of drug needed to produce 50% of its maximal effect. It is a measure of dose-efficiency and is indicated by the curve's position on the dose (x-axis).
- Efficacy and potency are independent properties. In clinical practice, efficacy is often the more critical determinant of a drug's usefulness.
These concepts provide you with a powerful quantitative lens to analyze the actions of any substance, whether it's a synthetic molecule or a complex herbal compound.
Preview of the Next Lesson:
We now know how to describe and quantify a drug's effect using dose-response curves. But how does a drug actually cause this effect at a molecular level? In our next lesson, we will explore the principles of receptor theory. We will learn how drugs act as "keys" that fit into cellular "locks" (receptors) to initiate the physiological responses we've measured today.