Hello! Welcome back to your course on Grade 12 Accountancy.
In our last lesson, we mastered Comparative Statements, which use horizontal analysis to track the performance of a company across different time periods. We learned to calculate absolute and percentage changes to see how figures have grown or declined year-on-year.
Today, we will learn about our second major tool for analysis: Common-Size Statements. This tool uses vertical analysis to understand the internal structure and composition of a company's finances within a single period. By the end of this lesson, you will be able to prepare a Common-Size Statement of Profit & Loss and a Common-Size Balance Sheet, fulfilling a key requirement of your syllabus.
1. The Concept of Common-Size Statements (Vertical Analysis)
While comparative statements look across years, common-size statements look down a financial statement for a single year. They convert every figure into a percentage of a common base item. This allows us to see the proportion of each component relative to a significant total. For example, what percentage of our revenue was spent on employee benefits? Or what percentage of our total assets are made up of inventory?
This is why it's called vertical analysis—we analyse items vertically within the same column or period. It's also sometimes called a "100% statement" because the common base is always taken as 100%.
To get started, let's review the formal definition and procedure from your NCERT textbook.
Analysis of Financial Statements
This section of your textbook formally introduces common-size statements, also known as component percentage statements, and outlines the simple procedure for preparing them.
Please read Section 4.6, 'Common Size Statement,' on page 182 of the PDF. Focus on understanding the definition and the three-step procedure listed just below it.
2. The Two Golden Rules: Choosing the Common Base
The entire process hinges on one key decision: what is the "common base"? The rule is simple and must be memorized:
- For the Common-Size Balance Sheet, the base is Total Assets (which is always equal to Total Equity and Liabilities). Every asset, liability, and equity item is expressed as a percentage of this total.
- For the Common-Size Statement of Profit & Loss, the base is Revenue from Operations (Net Sales). Every other income, expense, and profit figure is expressed as a percentage of this amount.
Let's watch a short video that clearly explains these two crucial rules.
Common size Statements | Chapter 4 | Accountancy | Class 12
The video 'Common size Statements' by Rajat Arora, who also guided us on comparative statements, breaks down this core concept of the common base for both statements.
Watch from 01:22 to 07:30. Pay close attention to: The explanation of the common base for the Balance Sheet (Total Assets). The explanation of the common base for the Statement of P&L (Revenue from Operations).
3. Preparing a Common-Size Balance Sheet
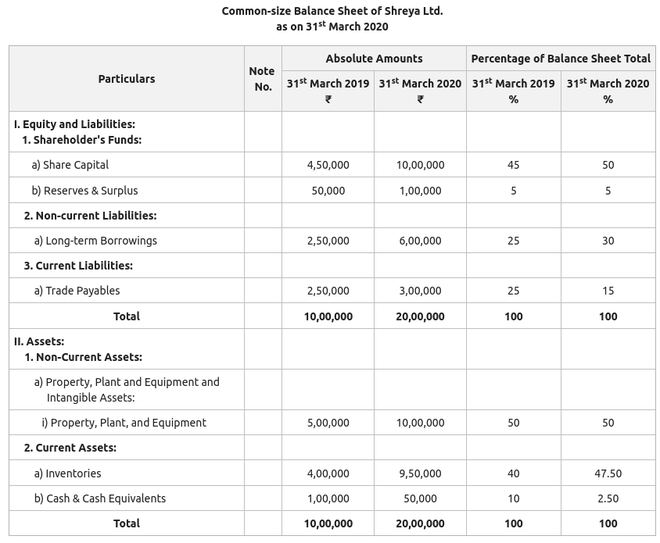
Let's put this into practice. To create a Common-Size Balance Sheet, we add two columns to our standard format to show the percentages for the previous and current years.
The formula for each item is:
This calculation is done independently for each year. Now, let's watch a practical demonstration.
Common size Statements | Chapter 4 | Accountancy | Class 12
This segment of the video walks through a full example of preparing a Common-Size Balance Sheet.
Watch from 07:30 to 15:55. Observe how the percentages for 2018 are calculated using the 2018 total as the base, and the percentages for 2019 are calculated using the 2019 total. Notice that the 'Total' line for both assets and liabilities will always be 100%.
Here is a static image of a completed Common-Size Balance Sheet, which you can use as a quick reference for the format.
Test your understanding!
A company's Balance Sheet shows the following for the current year:
- Share Capital: ₹12,00,000
- Long-term Borrowings: ₹8,00,000
- Total Assets: ₹20,00,000
What percentage of the Balance Sheet total is Share Capital?
Show answer
The base is Total Assets (₹20,00,000).
Percentage for Share Capital = (₹12,00,000 / ₹20,00,000) × 100 = 60%.
4. Preparing a Common-Size Statement of Profit & Loss
The process for the Statement of Profit & Loss is identical, but we use a different base. Here, every line item is expressed as a percentage of Revenue from Operations.
The formula for each item is:
Let's see this in action.
Common size Statements | Chapter 4 | Accountancy | Class 12
Continuing with the same video, let's now look at the preparation of a Common-Size Statement of P&L.
Watch from 15:55 to 20:29. The key thing to notice is that every single calculation uses the 'Revenue from Operations' figure for that year as the denominator.
Test your understanding!
A company's Statement of P&L shows the following:
- Revenue from Operations: ₹10,00,000
- Employee Benefit Expenses: ₹3,00,000
- Other Expenses: ₹1,00,000
What percentage of Revenue from Operations are the Total Expenses?
Show answer
-
Calculate Total Expenses:
- Total Expenses = ₹3,00,000 + ₹1,00,000 = ₹4,00,000
-
Calculate Percentage:
- The base is Revenue from Operations (₹10,00,000).
- Percentage = (₹4,00,000 / ₹10,00,000) × 100 = 40%.
Conclusion
Excellent work! You have now added another powerful analytical tool to your accounting toolkit. By mastering both comparative and common-size statements, you can analyze a company's financial health from two distinct and complementary angles.
Key Takeaways:
- Common-size statements perform vertical analysis, examining the composition of financial statements within a single period.
- The key is to express every item as a percentage of a common base.
- For the Balance Sheet, the common base is Total Assets.
- For the Statement of Profit & Loss, the common base is Revenue from Operations.
- The calculations for each year are performed independently.
Preview of the Next Lesson:
So far, we have focused on the preparation of these analytical statements. But what do all these numbers and percentages actually mean? In our next lesson, we will shift our focus to interpretation. We will learn how to read the trends and structures revealed by comparative and common-size statements to draw meaningful conclusions about a company's financial performance and position.