Hello! Welcome back to our course on Grade 12 Accountancy.
In our last lesson, we set the stage for this module by exploring the "why" and "what to watch out for" in financial statement analysis. We discussed its objectives—what we hope to achieve—and its limitations, such as its historical nature and vulnerability to window dressing.
Today, we move from theory to practice. We will learn our first hands-on tool for analysis: Comparative Statements. This tool helps us see how a company's financial performance and position have changed over time. By the end of this lesson, you will be able to prepare both a Comparative Statement of Profit & Loss and a Comparative Balance Sheet, a key skill for your CBSE exams.
1. What are Comparative Statements?
Comparative statements are financial statements (like the Balance Sheet and Statement of P&L) that present data for two or more consecutive accounting periods side-by-side. The purpose is to easily identify the direction and magnitude of changes in a company's financial data. This type of analysis, which looks at data across time, is also known as horizontal analysis.
To prepare these statements, we add two new columns to our standard financial reports:
- Absolute Change: The increase or decrease in the amount of an item from one period to the next.
- Percentage Change: The absolute change expressed as a percentage of the base year's amount.
Let's begin by watching a video that clearly explains this concept and the structure we will use.
Comparative Statements | Chapter 3 | Accountancy | Class 12
This video by Rajat Arora will introduce you to the core idea of comparative statements and the standard four-column format used for analysis.
Please watch from 00:31 to 04:40. Focus on: The purpose of comparing figures from two consecutive years. The names and formulas for the four key columns: Previous Year (A), Current Year (B), Absolute Change (C = B - A), and Percentage Change (D = C/A * 100).
As the video explained, the fundamental formulas you need to remember are:
- Absolute Change = Current Year Figure – Previous Year Figure
- Percentage Change = (Absolute Change / Previous Year Figure) × 100
These two formulas are the engine for our entire analysis in this lesson.
2. Preparing a Comparative Statement of Profit & Loss
Let's apply this process to the Statement of Profit & Loss. This will help us analyse how a company's profitability has evolved over a year.
The first step is to set up the statement in the prescribed format as per Schedule III of the Companies Act, 2013. You should be familiar with this from your previous studies. Here's a quick visual reminder of the structure.
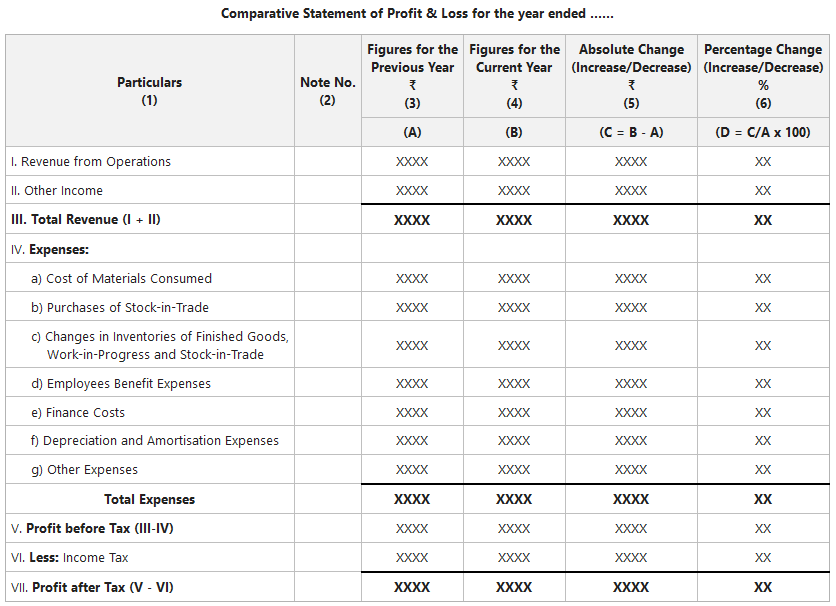
Once the structure is ready, we simply populate the figures for the two years and apply our formulas. The following video provides an excellent, step-by-step walkthrough of this process.
Comparative statements | 4 Marks fixed | Concept & Questions | Class 12 Accounts Board exam 2025
Let's watch a practical demonstration. This segment from the video by Sunil Panda will guide you through creating a Comparative Statement of P&L from scratch.
Watch from 13:17 to 22:07. Pay close attention to: How the statement is first arranged into the correct format (Revenue, Expenses, Profit, etc.). The calculation of Absolute Change and Percentage Change for each line item, including revenue, expenses, and profit.
To summarise the process:
- Arrange the Data: Create the format for the Statement of P&L with columns for Particulars, Note No., Previous Year, Current Year, Absolute Change, and Percentage Change.
- Input Figures: Fill in the data for the Previous and Current years.
- Calculate Absolute Change: For each item, subtract the Previous Year's figure from the Current Year's figure. A negative result (shown in brackets) indicates a decrease.
- Calculate Percentage Change: For each item, divide its Absolute Change by the Previous Year's figure and multiply by 100. A negative percentage also indicates a decrease.
Test your understanding!
A company's Revenue from Operations was ₹20,00,000 in the previous year and ₹25,00,000 in the current year. Its expenses were ₹12,00,000 in the previous year and ₹14,00,000 in the current year. Assuming no tax, calculate the percentage change in the company's profit.
Show answer
-
Calculate Profit for Both Years:
- Previous Year Profit = ₹20,00,000 - ₹12,00,000 = ₹8,00,000
- Current Year Profit = ₹25,00,000 - ₹14,00,000 = ₹11,00,000
-
Calculate Absolute Change in Profit:
- Absolute Change = ₹11,00,000 - ₹8,00,000 = ₹3,00,000
-
Calculate Percentage Change in Profit:
- Percentage Change = (₹3,00,000 / ₹8,00,000) × 100 = 37.5%
3. Preparing a Comparative Balance Sheet
The procedure for preparing a Comparative Balance Sheet is exactly the same as for the Statement of Profit & Loss. The only difference is the set of items we are analysing—assets, liabilities, and equity.
Here is the standard format for a Comparative Balance Sheet:

Let's turn to your NCERT textbook, which provides a clear, solved illustration of preparing a Comparative Balance Sheet.
Analysis of Financial Statements
The NCERT textbook offers an authoritative example of how to prepare a Comparative Balance Sheet. Let's walk through it.
Please read 'Illustration 3' on pages 179-180 of the PDF. The question provides two years of Balance Sheet data for J. Ltd., and the solution demonstrates how to compute the absolute and percentage changes for each item of liability and asset. Note how negative changes (decreases) are shown in brackets.
The example reinforces that the logic remains consistent:
- Arrange the Data: Lay out the Balance Sheet items as per Schedule III.
- Input Figures: Place the Previous Year and Current Year figures in their respective columns.
- Calculate Changes: Systematically compute the Absolute and Percentage changes for every single line item, from Share Capital to Cash and Cash Equivalents.
An Important Note on Column Order:
You might notice that some books or teachers place the "Current Year" column before the "Previous Year" column. This is perfectly fine! The calculation logic does not change. The formula for Absolute Change is always Current Year - Previous Year, regardless of where the columns are physically located on the page.
Test your understanding!
From the following data, calculate the absolute and percentage change for Long-term Borrowings.
| Particulars | Previous Year (₹) | Current Year (₹) |
|---|---|---|
| Share Capital | 5,00,000 | 6,00,000 |
| Long-term Borrowings | 4,00,000 | 3,00,000 |
| Trade Payables | 1,00,000 | 1,50,000 |
Show answer
-
Absolute Change:
- Current Year (₹3,00,000) - Previous Year (₹4,00,000) = (₹1,00,000). This is a decrease.
-
Percentage Change:
- (Absolute Change / Previous Year) × 100 = ( (₹1,00,000) / ₹4,00,000 ) × 100 = (25%). This is a 25% decrease.
Conclusion
Congratulations! You have just learned how to prepare the first key analytical tool in your syllabus. This skill is not only crucial for your exams but is also fundamental to how real-world analysts assess a company's progress.
Key Takeaways:
- Comparative statements perform a horizontal analysis, comparing financial data across two time periods.
- The preparation involves adding two columns: Absolute Change (
Current Year - Previous Year) and Percentage Change ((Absolute Change / Previous Year) * 100). - The process is identical for both the Statement of Profit & Loss and the Balance Sheet.
- Decreases are typically shown in brackets for both absolute and percentage figures.
Preview of the Next Lesson:
We have just mastered horizontal analysis (comparing across time). In our next lesson, we will learn about Common-Size Statements, which involve vertical analysis. Instead of comparing an item to its value last year, we will compare every item to a common base within the same year (e.g., expressing all expenses as a percentage of Revenue from Operations). This will give us a different but equally valuable perspective on the company's financial structure.