Hello! Welcome to the next lesson in your Grade 12 Accountancy course.
In our last two lessons, we learned how to prepare Comparative and Common-Size Statements. You now know how to perform both horizontal analysis (comparing across time) and vertical analysis (examining the internal structure). But preparing statements is only half the battle. The real value lies in understanding what those numbers mean.
Today, we will focus on interpretation. We'll learn how to read the trends, patterns, and structural shifts revealed by these statements to draw meaningful conclusions about a company's financial performance and position. This lesson directly addresses the learning outcome: Interpret trends and financial structure from comparative and common-size statements.
By the end of this lesson, you will be able to look at a completed statement and explain what it says about the company's health and strategy.
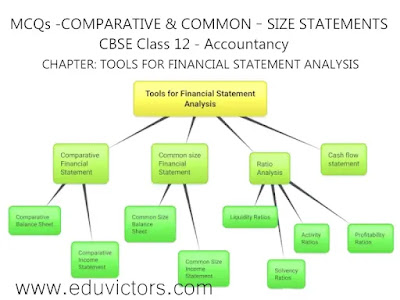
1. Interpreting Comparative Statements: Uncovering Trends
Comparative statements are all about analyzing trends over time. By looking at the absolute and percentage changes, we can answer critical questions about a company's trajectory. Is it growing? Is it becoming more or less profitable? Is its financial position getting stronger or weaker?
Interpreting the Comparative Statement of Profit & Loss
When you look at a Comparative Statement of P&L, you are primarily assessing the trend in profitability and operational efficiency.
Key questions to ask:
- Revenue vs. Expenses: Did Revenue from Operations grow? More importantly, did it grow faster than the total expenses?
- If revenue grows by 20% but expenses only grow by 10%, it signals improving profitability and cost control.
- If expenses grow faster than revenue, profits will shrink, indicating potential problems with efficiency or pricing.
- Profitability Trend: Look at the percentage change in Profit Before Tax (PBT) and Profit After Tax (PAT). A healthy, growing company will typically show a strong positive change here.
Interpreting the Comparative Balance Sheet
When you analyze a Comparative Balance Sheet, you are assessing the trend in the company's financial structure and solvency.
Key questions to ask:
- Asset Composition: Is the company investing in long-term growth? An increase in Non-Current Assets (like Property, Plant, and Equipment) often suggests this.
- Financing Mix (Capital Structure): How is the company funding its assets? Compare the growth in Shareholders' Funds to the growth in Non-Current Liabilities (like Long-term Borrowings).
- If equity is growing faster than debt, the company is relying more on its owners' funds, which is generally less risky.
- If debt is growing significantly faster than equity, the company is increasing its financial leverage, which can increase both risk and potential returns.
Let's watch a video where the instructor not only calculates the figures but also provides simple interpretations of what they mean.
Comparative & commons size statement ONE SHOT. Concept & Questions Class 12 Accounts BOARD EXAM 2024
In this video by Sunil Panda, we'll revisit the examples for comparative statements. This time, focus not on the calculations, but on the conclusions the instructor draws from the results.
Watch the following two segments: Comparative Balance Sheet (05:07 - 15:19): Pay attention around the 13:00 mark where he interprets the increase in assets as a positive sign. Comparative Income Statement (15:19 - 29:18): Notice around the 25:00 mark how he analyzes the impressive growth in sales and the corresponding growth in profit. Focus on how he translates a percentage change into a business insight (e.g., 'good growth', 'expenses are increasing').
2. Interpreting Common-Size Statements: Analyzing Structure
Common-size statements are about analyzing structure. They help us understand the composition of a company's finances at a specific point in time and how that composition is evolving. They allow us to see the 'big picture' by showing the relative importance of each item.
Interpreting the Common-Size Statement of Profit & Loss
This statement reveals the company's cost structure. Every expense is shown as a percentage of Revenue from Operations.
Key questions to ask:
- Cost of Revenue: What percentage of revenue is eaten up by key expenses like Cost of Materials Consumed or Employee Benefit Expenses? Is this percentage increasing or decreasing over the years? A decreasing percentage is a sign of improved efficiency.
- Net Profit Margin: The percentage for Profit After Tax is effectively the Net Profit Ratio. It tells you how many rupees of profit the company keeps for every 100 rupees of revenue. An increasing Net Profit Margin is a strong indicator of improving profitability.
Interpreting the Common-Size Balance Sheet
This statement reveals the company's asset mix and capital structure. Every item is shown as a percentage of Total Assets / Total Liabilities.
Key questions to ask:
- Asset Structure: What proportion of the company's total assets are Non-Current vs. Current? A manufacturing company will likely have a high percentage of Non-Current Assets, while a trading company might have more Current Assets (like inventory).
- Capital Structure: What percentage of the company is financed by owners (Shareholders' Funds) versus outsiders (Non-Current and Current Liabilities)? A higher percentage of liabilities, especially debt, indicates higher financial risk. Comparing these percentages across two years shows if the company is becoming more or less reliant on debt.
Let's return to the video to see how these structural interpretations are made.
Comparative & commons size statement ONE SHOT. Concept & Questions Class 12 Accounts BOARD EXAM 2024
Now we'll look at the common-size statement examples from the same video. Your goal is to understand how each line item is viewed in relation to the 'base' amount.
Watch the following two segments: Common-Size Balance Sheet (37:58 - 45:19): Observe how the instructor explains that the percentages show what portion of the total balance sheet each item represents (e.g., Share Capital is 37.5% of the total). Common-Size Income Statement (45:19 - 51:00): Focus on how he interprets the percentages in relation to sales (e.g., '35% of my sales are Employee Benefit Expenses').
3. Practical Interpretation Exercise
Now it's your turn to be the analyst. Look at the Comparative Balance Sheet below and answer the questions.

Test your understanding!
Based on the image above, answer the following:
-
The company's total liabilities grew by 60%. How was this growth financed? Look at the percentage changes for Share Capital (100%) and Non-Current Liabilities (25%). What does this tell you about the company's financing strategy in 2024?
-
Trade Payables increased by 150%. What are two possible interpretations of this significant increase? (Think about both positive and negative reasons).
Show answer
-
The company financed its growth primarily through equity rather than long-term debt. Share Capital doubled (a 100% increase), while long-term debt only increased by 25%. This suggests a conservative, less risky financing strategy, as the company is relying more on owners' funds than borrowing from outsiders.
-
A 150% increase in Trade Payables could mean:
- Positive: The company has negotiated better credit terms with its suppliers, allowing it to hold onto its cash for longer. This is a sign of good supplier relationships and negotiating power.
- Negative: The company might be facing cash flow problems and is delaying payments to its suppliers. This could damage its reputation and relationship with suppliers in the long run.
To know which interpretation is correct, you would need more information, such as from the Cash Flow Statement. This shows how financial analysis often involves connecting information from multiple sources.
Conclusion
Great work today! You have moved beyond mere calculation to the crucial skill of interpretation. This is what turns numbers on a page into actionable business intelligence.
Key Takeaways:
- Comparative Statements (Horizontal Analysis) are used to analyze trends over time. The key is to compare the growth rates of related items (e.g., revenue vs. expenses).
- Common-Size Statements (Vertical Analysis) are used to analyze structure and composition. The key is to see the proportion of each item relative to a base (Total Assets or Revenue from Operations) and how that proportion changes.
- Analyzing both absolute and percentage changes gives a more complete picture of a company's financial story.
Preview of the Next Lesson:
We have now completed our look at the first two major tools of financial analysis. In the next module, we will dive into the most widely used tool: Ratio Analysis. While comparative and common-size statements give us a broad overview, ratios provide specific, standardized metrics to precisely measure a company's liquidity, solvency, efficiency, and profitability. You will see that some of the interpretations we did today are formalized as ratios, like the Net Profit Ratio.