Hello! Welcome to the first lesson in our module on Ratio Analysis.
In the previous module, we learned how to prepare and interpret Comparative and Common-Size Statements. These tools give us a "big picture" view of a company's performance over time and its financial structure. You saw how a simple percentage change could tell a story about growth or cost control.
Today, we dive into a more specific and powerful tool: Ratio Analysis. This lesson will equip you to calculate and interpret Liquidity Ratios, specifically the Current Ratio and the Quick (or Liquid) Ratio. These ratios are fundamental in assessing a company's ability to meet its short-term financial obligations—a critical aspect of its financial health.
By the end of this lesson, you will be able to look at a company's Balance Sheet data and determine if it has enough liquid resources to pay its bills on time.
1. What are Liquidity Ratios and Why Do They Matter?
Before we jump into formulas, it's essential to understand the 'why'. Financial ratios are relationships between two accounting numbers that help us analyze a company's performance and financial position. They are a core tool for investors, lenders, and managers.
Liquidity ratios, in particular, answer a simple but vital question: "Can the company pay its short-term debts?" Short-term debts are liabilities due within the next year. A company that cannot pay its bills is said to have a liquidity problem, which can lead to serious trouble, even bankruptcy.
To get a clear overview of ratio analysis and the concept of liquidity, let's watch the beginning of this detailed video.
Accounting Ratios Class 12 Accounts | Liquidity Ratios | Current & Liquid Ratios | #accountingratio
This video by CA Hardik Manchanda provides an excellent introduction to why we use accounting ratios. It also introduces the four main categories of ratios you will study.
Watch the first part of the video from the beginning up to the 16:24 mark. Focus on: The example comparing Company A and Company B to understand how ratios provide deeper insights than absolute numbers. The explanation of the four types of ratios: Liquidity, Solvency, Activity, and Profitability. The introduction to what Liquidity Ratios tell us about a company's short-term financial health.
As you just saw, liquidity is about a company's ability to meet its immediate financial obligations. We'll now look at the two primary ratios used to measure this.
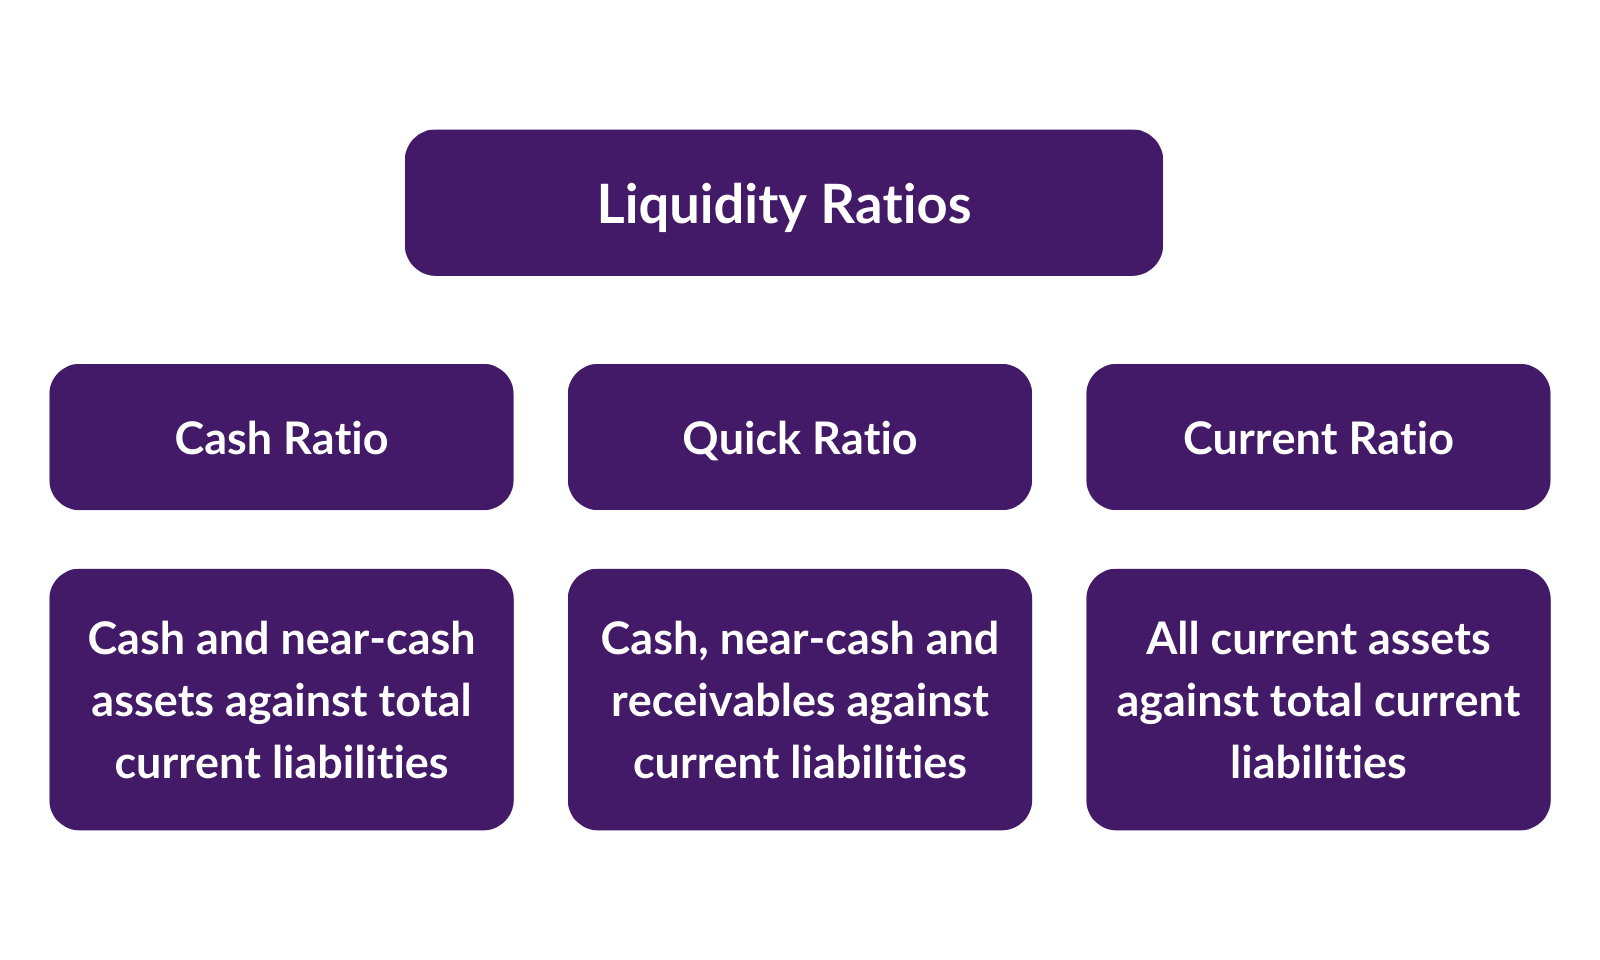
2. The Current Ratio: The First Check-up
The Current Ratio is the most common liquidity ratio. It provides a broad overview by comparing all of a company's current assets to all of its current liabilities.
The formula is:
What are Current Assets and Current Liabilities?
You'll recall from your Grade 11 basics and our work on company final accounts that:
- Current Assets are assets expected to be converted into cash or used up within one year or the operating cycle. Key examples include:
- Current Investments
- Inventories (but remember to exclude 'Loose Tools' and 'Stores and Spares')
- Trade Receivables (Debtors and Bills Receivable, after deducting any 'Provision for Doubtful Debts')
- Cash and Cash Equivalents
- Short-term Loans and Advances
- Other Current Assets (like Prepaid Expenses, Accrued Income)
- Current Liabilities are obligations due for payment within one year or the operating cycle. Key examples include:
- Short-term Borrowings
- Trade Payables (Creditors and Bills Payable)
- Other Current Liabilities (like Unclaimed Dividend, Calls-in-Advance, Outstanding Expenses)
- Short-term Provisions (like Provision for Tax)
Interpretation of the Current Ratio
A general rule of thumb is that an ideal Current Ratio is 2:1. This means the company has ₹2 of current assets for every ₹1 of current liabilities.
- Why 2:1? One rupee of assets is needed to pay the one rupee of liability. The second rupee provides a safety margin and covers the funds needed for day-to-day operations (known as working capital).
- A high ratio (e.g., 3:1) suggests strong liquidity but could also indicate inefficient use of assets (e.g., too much cash sitting idle or high levels of inventory).
- A low ratio (e.g., 1.2:1) signals potential liquidity risk. The company might struggle to pay its bills if its assets cannot be converted to cash quickly.
Let's see how this is applied in a problem.
Accounting Ratios | Class 12 | Part 3 | Current ratio and quick ratio
The following video by Rajat Arora demonstrates a typical exam-style question where you need to calculate the Current Ratio by first identifying the relevant assets and liabilities.
Watch the section from 01:31 to 09:45. Pay close attention to how: A simplified Balance Sheet format is used to find the values of Current Assets and Current Liabilities when they are not given directly. The Working Capital formula (Current Assets - Current Liabilities) is used to find a missing figure. This is a very common technique in ratio problems.
3. The Quick Ratio: A Stricter Test
The Current Ratio is useful, but it has a weakness: it assumes all current assets can be converted to cash easily. In reality, inventory can be hard to sell, and prepaid expenses can't be converted to cash at all.
The Quick Ratio, also known as the Acid-Test Ratio or Liquid Ratio, provides a more conservative measure of liquidity by excluding these less-liquid assets.

The formula is:
Where,
Why are Inventory and Prepaid Expenses excluded?
- Inventory: There is no guarantee that inventory can be sold quickly, or that it will be sold at its full value. It's often the least liquid of the current assets.
- Prepaid Expenses: These represent payments for future services (like insurance or rent). They cannot be converted back into cash to pay other liabilities.
Interpretation of the Quick Ratio
The ideal Quick Ratio is considered to be 1:1. This indicates that the company has enough highly liquid assets to cover every rupee of its current liabilities without needing to sell any inventory.
For a deeper understanding and a clear comparison between the two ratios, please study the following material.
Accounting Ratios notes for CBSE Class 12 Accountancy
This guide from Topperlearning provides a concise summary of both ratios, including the components and ideal benchmarks. It also includes a useful table comparing the two.
Read the sections titled 'Meaning and Computation of Current Ratio' and 'Meaning and Computation of Quick or Acid Test Ratio'. Focus on: The detailed lists of what is included in Current Assets and Current Liabilities. The explanation of Liquid Assets and why certain items are excluded. The 'Difference between Current Ratio and Quick Ratio' table.
Test your understanding!
A company's Current Ratio is 2.5:1, and its Quick Ratio is 0.9:1. Both ratios are calculated on the same Current Liabilities of ₹1,00,000.
- What does the significant difference between the two ratios suggest about the composition of the company's current assets?
- Based on the Quick Ratio, would you say the company is in a comfortable liquidity position? Why or why not?
Show answer
-
A Current Ratio of 2.5:1 implies Current Assets are ₹2,50,000 (2.5 * ₹1,00,000). A Quick Ratio of 0.9:1 implies Quick Assets are ₹90,000 (0.9 * ₹1,00,000). The large difference between Current Assets (₹2,50,000) and Quick Assets (₹90,000) of ₹1,60,000 is due to Inventory and/or Prepaid Expenses. This indicates that a very large portion of the company's current assets is tied up in inventory, which is not easily convertible to cash.
-
No, the company is not in a comfortable position despite the healthy Current Ratio. The Quick Ratio of 0.9:1 is below the ideal of 1:1. This means the company does not have enough liquid assets to cover its current liabilities and is heavily reliant on selling its inventory to pay its bills. This is a risky situation.
4. Summary of Key Differences
To consolidate your understanding, here is a clear comparison between the two ratios. This format is especially helpful for answering theory questions in your exams.
| Basis of Difference | Current Ratio | Quick Ratio / Acid-Test Ratio |
|---|---|---|
| Objective | Measures ability to meet short-term obligations within a year. | Measures ability to meet immediate short-term obligations. |
| Formula | Current Assets / Current Liabilities | Quick Assets / Current Liabilities |
| Assets Included | All current assets. | Only highly liquid assets (excludes Inventory and Prepaid Expenses). |
| Ideal Ratio | 2:1 | 1:1 |
| Indicator | A general indicator of liquidity. | A stricter and often more realistic indicator of liquidity. |
Conclusion
Excellent work today! You have learned how to calculate and, more importantly, interpret the two fundamental liquidity ratios. This is a crucial first step in analyzing a company's financial stability.
Key Takeaways:
- Liquidity Ratios assess a firm's ability to pay its short-term debts.
- Current Ratio = Current Assets / Current Liabilities. It gives a broad view of liquidity, with an ideal benchmark of 2:1.
- Quick Ratio = Quick Assets / Current Liabilities. It provides a stricter test by excluding inventory and prepaid expenses, with an ideal benchmark of 1:1.
- Comparing the two ratios can reveal how much a company relies on selling its inventory to maintain liquidity.
Preview of the Next Lesson:
Now that you can assess a company's short-term financial health, we will move on to its long-term stability. In the next lesson, we will explore Solvency Ratios, such as the Debt-to-Equity Ratio and Total Assets to Debt Ratio. These ratios help us understand how a company has financed its assets and its ability to meet its long-term debt obligations.