Hello! Welcome back to our course on Accounting Fundamentals.
In our last lesson, we focused on a company's short-term financial health by learning to calculate and interpret Liquidity Ratios like the Current Ratio and Quick Ratio. You learned how to answer the question, "Can the company pay its immediate bills?"
Today, we shift our focus from the short-term to the long-term. This lesson is designed to help you calculate and interpret key Solvency Ratios: the Debt-to-Equity Ratio, the Total Assets to Debt Ratio, and the Proprietary Ratio. These ratios help us understand a company's ability to meet its long-term financial obligations, which is crucial for assessing its long-term survival and stability.
By the end of this lesson, you'll be able to analyze a company's balance sheet to determine how it finances its assets and whether it carries a sustainable level of debt.
1. From Liquidity to Solvency: The Long-Term View
While liquidity ratios assess if a company can survive the next year, solvency ratios assess if it can survive over a much longer period. They answer critical questions for long-term lenders and investors, such as:
- How much does the company rely on borrowed money versus the owners' own funds?
- Are there enough assets to cover long-term debts in case of financial trouble?
- Is the company's financial structure stable enough to ensure its long-term viability?
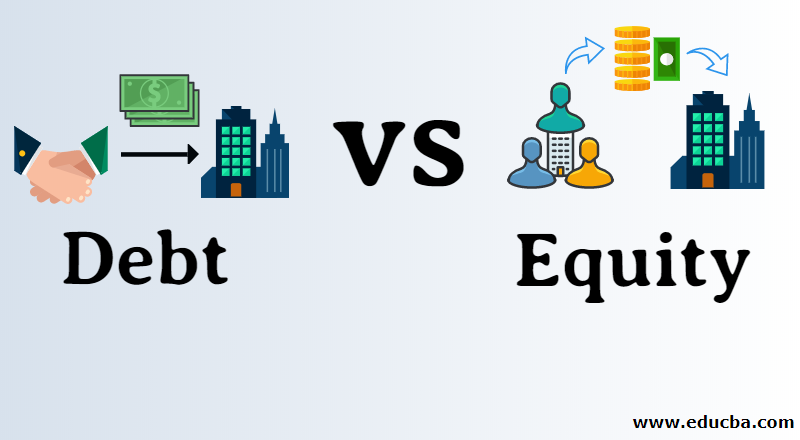
At the heart of solvency analysis is the relationship between Debt (funds from outsiders/lenders) and Equity (funds from owners/shareholders).
To get a clear introduction to solvency ratios, let's start with a video that outlines their purpose.
Solvency Ratios | Accounting Ratios | Class 12 | PART 5
This video from Rajat Arora introduces the concept of solvency ratios and lists the key ratios we will be covering in this lesson.
Watch the segment from 00:41 to 01:09. Focus on the core purpose of solvency ratios: to assess the long-term financial position of an organization.
Now, let's dive into the three main solvency ratios.
2. Debt-to-Equity Ratio
This is perhaps the most important solvency ratio. It directly compares the funds provided by long-term lenders (debt) to the funds provided by owners (equity).
The formula is:
Understanding the Components:
- Long-term Debt (or simply 'Debt'): This includes all liabilities that are due for payment after more than one year. It primarily consists of:
- Long-term Borrowings (e.g., Debentures, Bonds, Long-term Loans from banks).
- Long-term Provisions.
- Note: It does not include Current Liabilities.
- Shareholders' Funds (Equity): This represents the owners' stake in the company. It is calculated as:
- Share Capital (Equity Share Capital + Preference Share Capital)
- Reserves and Surplus (e.g., General Reserve, Balance in Statement of P&L).
Interpretation:
- A generally accepted "safe" benchmark for the Debt-to-Equity ratio is 2:1. This means the company has ₹2 of debt for every ₹1 of equity.
- High Ratio (> 2:1): This indicates a risky position for lenders, as the business is more dependent on borrowed funds than on owners' funds. It suggests a lower safety margin for creditors.
- Low Ratio (< 2:1): This indicates a safer position. It means the company is less dependent on debt and has a larger safety cushion for lenders.
To see how this is calculated and interpreted, let's watch the next part of the video.
Solvency Ratios | Accounting Ratios | Class 12 | PART 5
This segment of the video explains the Debt-to-Equity ratio in detail, covering its formula, components, and what a high or low ratio signifies.
Watch the video from 01:09 to 04:46. Pay attention to the breakdown of 'Debt' and 'Equity' and the discussion around the 2:1 benchmark.
For a more formal definition and a detailed worked example, please review the following section from your NCERT textbook.
The NCERT textbook provides the official definition and a clear, solved illustration of the Debt-to-Equity ratio using a complete balance sheet.
Read section '5.7.1 Debt-Equity Ratio'. Focus on the definition, formula, and the calculation shown in 'Illustration 7'. Notice how 'Debt' and 'Equity' are identified from the balance sheet items.
3. Total Assets to Debt Ratio
This ratio measures the safety margin available to long-term lenders by showing how many times the total assets of the company cover its long-term debt.
The formula is:
Understanding the Components:
- Total Assets: The sum of all Non-Current Assets and Current Assets.
- Long-term Debt: Same as defined for the Debt-to-Equity ratio.
Interpretation:
- There is no fixed ideal ratio, but a higher ratio is always better.
- A high ratio indicates a high level of safety for lenders, as it means the company has plenty of assets to cover its long-term obligations. For example, a ratio of 4:1 means there are ₹4 of assets for every ₹1 of long-term debt.
- A low ratio suggests greater risk for long-term lenders.
Watch the next clip to see a practical explanation.
Solvency Ratios | Accounting Ratios | Class 12 | PART 5
Rajat Arora now explains the Total Assets to Debt Ratio, demonstrating its calculation and emphasizing why a higher ratio is considered safer.
Watch from 04:46 to 07:48. Focus on how the ratio provides a 'safety cover' for lenders and how to interpret the result.
4. Proprietary Ratio
This ratio reveals the proportion of a company's total assets that has been financed by shareholders' funds (equity). It is a direct measure of the owners' contribution to the company's asset base.
The formula is:
Understanding the Components:
- Shareholders' Funds (Equity): Same as defined before.
- Total Assets: Same as defined before.
Interpretation:
- Like the Total Assets to Debt Ratio, there is no fixed ideal, but a higher ratio is considered safer.
- It is often expressed as a pure ratio (e.g., 0.6:1) or a percentage (60%).
- A high ratio (e.g., 0.7:1 or 70%) indicates a strong financial position, as a large portion of assets is funded by owners. This provides a significant safety margin for creditors.
- A low ratio signifies a greater reliance on debt to acquire assets, which increases the risk for lenders.
Let's complete our video session with the explanation of this final ratio.
Solvency Ratios | Accounting Ratios | Class 12 | PART 5
The final segment explains the Proprietary Ratio, showing its connection to the other solvency ratios and what it tells us about the company's financial structure.
Watch from 07:48 to 09:14. Understand that this ratio shows the proportion of assets funded by the proprietors (owners).
Test your understanding!
Now it's your turn to apply what you've learned. Calculate the (i) Proprietary Ratio, (ii) Debt to Equity Ratio, and (iii) Total Assets to Debt Ratio from the information given in the image below.

Hint: First, calculate the three key figures needed for these ratios:
- Shareholders' Funds (Equity)
- Long-term Debt
- Total Assets
Show answer
Let's break down the calculation step-by-step.
1. Calculate the core components:
-
Shareholders' Funds (Equity):
- Equity Share Capital + 12% Preference Share Capital + General Reserve + Surplus
- ₹7,50,000 + ₹2,50,000 + ₹2,00,000 + ₹1,50,000 = ₹13,50,000
-
Long-term Debt:
- The only long-term debt item given is 10% Debentures.
- Long-term Debt = ₹4,50,000
-
Total Assets:
- Net Fixed Assets + Non-current Investments + Current Assets
- ₹9,00,000 + ₹1,50,000 + ₹9,00,000 = ₹19,50,000
2. Calculate the Ratios:
-
(i) Proprietary Ratio:
- Interpretation: 69% of the company's total assets are financed by the owners' funds, which is a healthy and safe position.
-
(ii) Debt to Equity Ratio:
- Interpretation: For every ₹1 of equity, the company only has ₹0.33 of long-term debt. This is well below the 2:1 benchmark and indicates very low risk for lenders.
-
(iii) Total Assets to Debt Ratio:
- Interpretation: The company's assets cover its long-term debt 4.33 times over. This provides a very high safety margin for lenders.
Conclusion
Great job! You have now mastered the tools to assess a company's long-term financial stability. By understanding how to calculate and interpret solvency ratios, you can form a judgment about a company's financial structure and its ability to meet obligations in the long run.
Key Takeaways:
- Solvency Ratios measure a company's ability to meet its long-term debts.
- Debt-to-Equity Ratio = Long-term Debt / Equity. It compares lenders' funds to owners' funds, with a common benchmark of 2:1.
- Total Assets to Debt Ratio = Total Assets / Long-term Debt. It shows the asset coverage available to long-term lenders. A higher ratio is better.
- Proprietary Ratio = Equity / Total Assets. It shows the proportion of assets financed by owners. A higher ratio indicates greater safety.
Preview of the Next Lesson:
So far, we have analyzed a company's short-term health (Liquidity) and long-term stability (Solvency). In our next lesson, we will move on to analyze its operational efficiency. We will explore Activity (or Turnover) Ratios, which measure how effectively a company is using its assets, like inventory and receivables, to generate revenue.