Hello! Let's dive into the final and perhaps most important category of accounting ratios.
In our previous lessons, we've analyzed a company's liquidity (ability to meet short-term debts), solvency (long-term financial health), and activity levels (efficiency in using assets). Now, we turn our attention to the bottom line: profitability. These ratios measure a company's ability to generate earnings relative to its sales, assets, and equity. They are the ultimate test of a business's success.
This lesson will guide you through the calculation and interpretation of the four key profitability ratios for your Grade 12 syllabus:
- Gross Profit Ratio
- Operating Ratio
- Net Profit Ratio
- Return on Investment (ROI)
By the end of this lesson, you'll understand how these ratios tell a story about a company's performance at different stages of its operations.
1. The Landscape of Profitability Ratios
Profitability ratios are almost always expressed as a percentage. A higher percentage generally indicates better performance. These ratios help managers, investors, and creditors assess the earning power and operational efficiency of a business.
Let's look at a quick overview of this category.
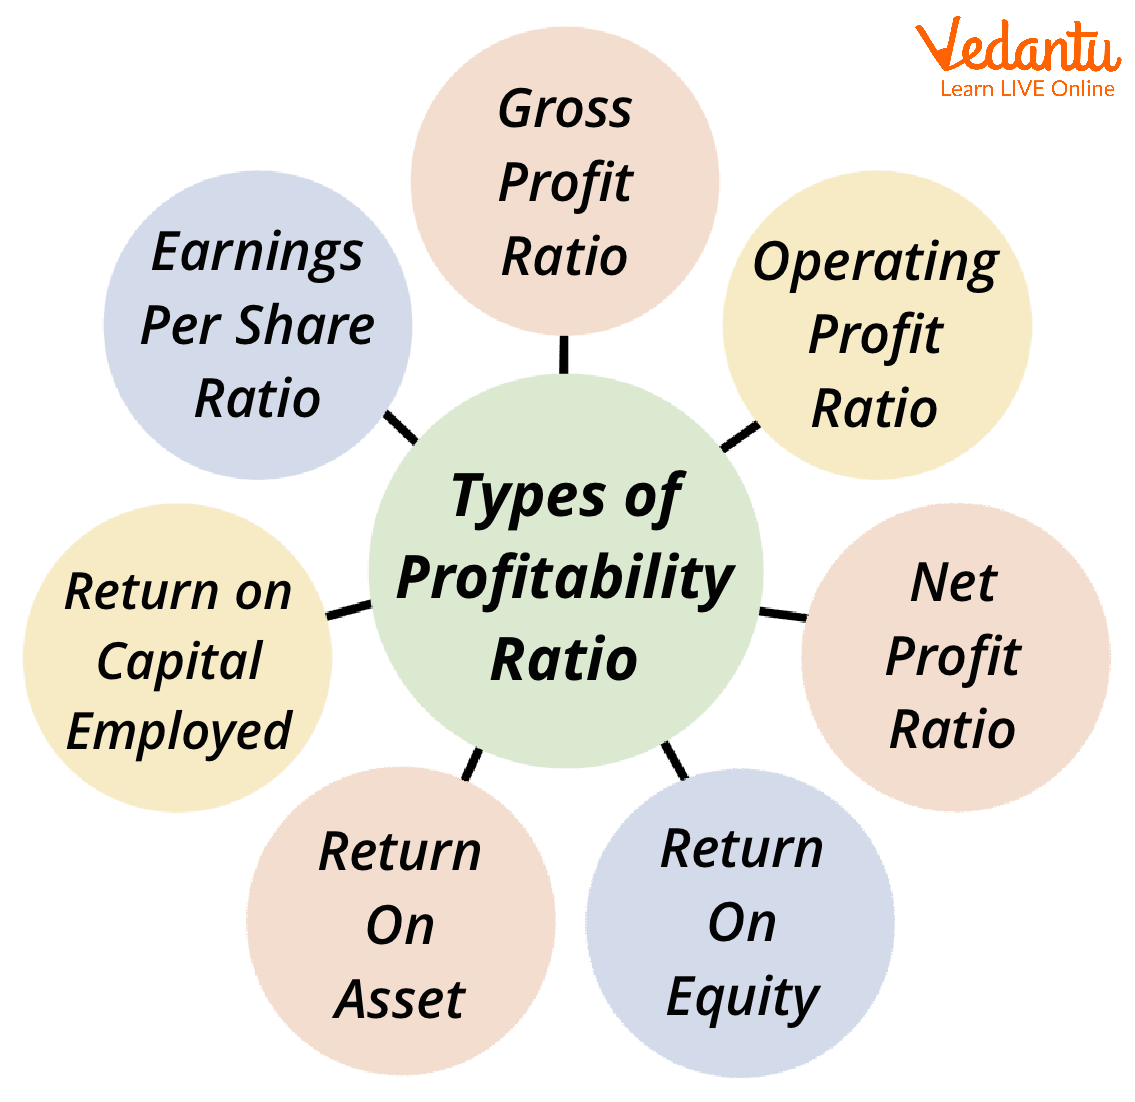
The most effective way to understand these ratios is to follow the flow of a company's Statement of Profit and Loss. We start with total sales and gradually deduct different types of costs to arrive at different levels of profit. Each ratio we study today will correspond to one of these levels.
Let's begin this journey.
2. Gross Profit Ratio
The Gross Profit Ratio measures the relationship between the gross profit and the revenue generated from sales. It tells you the profit margin on the goods sold, before considering any office, administrative, or selling expenses. In short, it reflects the efficiency of your production or purchasing operations.
Formula:
Where:
- Gross Profit = Revenue from Operations - Cost of Revenue from Operations (COGS)
To understand this concept and see how it's calculated, let's watch the first part of a comprehensive video on profitability ratios. The instructor will build a simple Profit & Loss statement to explain the concept, which aligns perfectly with the logical flow you prefer.
Profitability Ratios in 1 SHOT | Accounting Ratios Class 12 Accounts| Class 12 Accounts |
This first segment from CA Hardik Manchanda introduces profitability ratios and provides a clear, step-by-step explanation of the Gross Profit Ratio using a practical example.
Watch from the beginning to 08:00. Pay close attention to how Gross Profit is calculated as the first level of profit after deducting the direct 'Cost of Goods Sold' from 'Revenue from Operations'.
Key Takeaway: The Gross Profit Ratio shows the basic profitability of a product before any other business expenses are taken into account. A 60% Gross Profit Ratio means that for every ₹100 of sales, the company has ₹60 left over to cover its other operating and non-operating expenses.
3. Operating Ratio and Operating Profit Ratio
Once we have the Gross Profit, the next step is to account for the other expenses required to run the day-to-day business operations. These are called Operating Expenses (e.g., office salaries, rent, marketing costs, depreciation).
This brings us to two complementary ratios:
- Operating Ratio: Measures the proportion of total operating costs to sales.
- Operating Profit Ratio: Measures the profit margin earned from core business operations.
A crucial relationship exists between them:
This is because Operating Cost and Operating Profit are the two components of total sales revenue. If the cost of running the business takes up 70% of sales (Operating Ratio), then the profit from those operations must be the remaining 30% (Operating Profit Ratio).
Formulas:
OR
Let's continue with the video to see how these are calculated and how they relate to each other.
Profitability Ratios in 1 SHOT | Accounting Ratios Class 12 Accounts| Class 12 Accounts |
This segment continues building on the P&L statement. It explains how to calculate Operating Profit by deducting Operating Expenses from Gross Profit. It clearly demonstrates the formulas for both Operating Ratio and Operating Profit Ratio and their 100% relationship.
Watch from 08:00 to 16:35. Focus on identifying what constitutes an 'Operating Expense' and understand why the two ratios are two sides of the same coin.
Test your understanding!
A company has the following figures:
- Revenue from Operations: ₹20,00,000
- Cost of Revenue from Operations (COGS): ₹12,00,000
- Operating Expenses (Office & Selling): ₹3,00,000
Calculate the Gross Profit Ratio, Operating Ratio, and Operating Profit Ratio.
Show answer
1. Gross Profit:
- Gross Profit = Revenue - COGS = ₹20,00,000 - ₹12,00,000 = ₹8,00,000
- Gross Profit Ratio = (₹8,00,000 / ₹20,00,000) * 100 = 40%
2. Operating Cost & Operating Ratio:
- Operating Cost = COGS + Operating Expenses = ₹12,00,000 + ₹3,00,000 = ₹15,00,000
- Operating Ratio = (₹15,00,000 / ₹20,00,000) * 100 = 75%
3. Operating Profit & Operating Profit Ratio:
- Operating Profit = Gross Profit - Operating Expenses = ₹8,00,000 - ₹3,00,000 = ₹5,00,000
- Operating Profit Ratio = (₹5,00,000 / ₹20,00,000) * 100 = 25%
Verification: Operating Ratio (75%) + Operating Profit Ratio (25%) = 100%. The calculation is correct.
4. Net Profit Ratio
The final profit figure is the Net Profit, which is what remains after all expenses—both operating and non-operating—and taxes have been deducted. The Net Profit Ratio measures the overall profitability of the business.
Non-Operating Items include incomes and expenses not related to the main business activities, such as:
- Non-Operating Income: Interest received on investments, gain on sale of an asset.
- Non-Operating Expense: Interest paid on loans, loss on sale of an asset.
Formula:
Let's watch the next video segment to complete our P&L journey.
Profitability Ratios in 1 SHOT | Accounting Ratios Class 12 Accounts| Class 12 Accounts |
This clip explains how to arrive at Net Profit by adjusting Operating Profit for non-operating items and taxes. It concludes the explanation of the Net Profit Ratio.
Watch from 16:35 to 24:18. Observe how non-operating incomes are added and non-operating expenses and taxes are subtracted to find the final Net Profit.
The video series by CA Hardik Manchanda also contains many worked-out problems. You can refer to sections at 24:18 (GP Ratio problems), 44:25 (Operating Ratio problems), and 1:00:02 (Net Profit Ratio problems) for extra practice.
5. Return on Investment (ROI)
While the previous three ratios compared profit to sales, Return on Investment (ROI), also known as Return on Capital Employed (ROCE), takes a different perspective. It measures the overall profitability of the business in relation to the total capital invested. It answers the question: "How efficiently is the company using the funds of its shareholders and lenders to generate profits?"
Formula:
Why 'Profit Before Interest and Tax'?
We use PBIT because it represents the profit available to all providers of capital (both equity shareholders and debt holders/lenders) before any distributions are made to them (in the form of dividends or interest).
What is 'Capital Employed'?
It is the total long-term funds invested in the business. It can be calculated in two ways:
- Liabilities Side Approach:
Shareholders' Funds + Non-Current Liabilities (Long-term Debt) - Assets Side Approach:
Non-Current Assets + Working Capital (Current Assets - Current Liabilities)
Let's watch the final conceptual part of the video to understand the logic behind ROI.
Profitability Ratios in 1 SHOT | Accounting Ratios Class 12 Accounts| Class 12 Accounts |
This segment introduces the concept of ROI, explaining why it's a crucial measure of overall business efficiency and breaking down the components of its formula.
Watch from 1:10:09 to 1:25:08. Focus on understanding the meaning of 'Capital Employed' and why 'Profit Before Interest and Tax' is used in the numerator. The segment also includes worked-out examples that are very helpful.
For a quick reference of all the formulas covered today, you can consult this document.
Accounting Ratios notes for CBSE Class 12 Accountancy
These notes from Topperlearning provide concise definitions and formulas for all the profitability ratios we've discussed. It's a great summary to review.
Quickly scan through the sections 'Meaning and Computation of Gross Profit Ratio', 'Operating Ratio', 'Operating Profit Ratio', 'Net Profit Ratio', and 'Return on Investment'. This will reinforce the formulas you've just learned.
Conclusion
Fantastic work today! You have now navigated the complete spectrum of profitability analysis, from the initial gross margin on products to the overall return generated on invested capital. This skill is not just for exams; it's fundamental to understanding the financial health and performance of any business.
Key Takeaways:
- Gross Profit Ratio measures trading/production efficiency (
Gross Profit / Sales). - Operating Ratio shows the cost of core operations relative to sales (
Operating Cost / Sales). - Operating Profit Ratio shows the profit from core operations (
Operating Profit / Sales). Remember:Operating Ratio + Operating Profit Ratio = 100%. - Net Profit Ratio measures overall profitability after all expenses and taxes (
Net Profit After Tax / Sales). - Return on Investment (ROI) assesses how well management has used the funds from lenders and owners (
PBIT / Capital Employed).
Preview of the Next Lesson:
With our tour of Ratio Analysis complete, we will move on to the final major topic in your syllabus: the Cash Flow Statement. While the Profit & Loss statement tells us about profitability, the Cash Flow Statement reveals the actual movement of cash, showing where a company's money came from and where it went. This is a critical tool for assessing a company's liquidity and solvency in a dynamic way.