Hello! Welcome to the next lesson in our journey through Delta Live Tables.
In our last session, we covered how to configure DLT pipelines for different environments using Development and Production modes. You learned about the trade-offs between iteration speed and operational robustness, a crucial concept for managing the lifecycle of any data product.
Now that your pipelines are configured and running, the next critical task is to understand what's happening inside them. Today's learning outcome is to monitor DLT pipeline execution and interpret the event log. This is where we transition from building pipelines to operating them. We'll cover how to get a quick health check from the Databricks UI and then dive deep into the event log—the definitive source of truth for everything your pipeline does. Your experience building and maintaining data platforms will be valuable here, as we'll be focusing on programmatic ways to ensure reliability and observability.
1. Monitoring from the DLT User Interface
The DLT UI is your first port of call for monitoring. It provides a real-time, visual summary of your pipeline's health and progress.
When you run a pipeline, the UI presents three key areas for monitoring:
- The Data Flow Graph (DAG): Visually represents your pipeline's tables and their dependencies. Each node's color and status indicate whether it's setting up, running, completed successfully, or failed.
- Data Quality Metrics: The UI overlays key metrics directly onto the graph, showing you the number of records written, dropped, or that failed expectation checks.
- The Event Log Stream: A live feed at the bottom of the page shows chronological events as they happen, providing a high-level narrative of the pipeline update.

Diagnosing Issues with the UI
The UI is particularly effective for getting a quick diagnosis when things go wrong. Let's see a practical example of how to use the UI to identify and understand pipeline events.
30 DLT Data Quality & Expectations | Monitor DLT pipeline using SQL | Define DQ rule |Observability
This video from Ease With Data demonstrates how to use the DLT UI to both debug a failure and review data quality metrics from a successful run. It's a great real-world example of the UI in action.
Watch from 07:03 to 08:27. The first part shows how a failure is immediately visible in the UI and how clicking the failed event reveals the root cause. The second part shows how, after a fix, the data quality metrics for the completed run are displayed.
When a more severe error occurs, like a cluster failing to start, the event log provides a structured JSON payload with detailed error information. You can access this directly from the UI by clicking on the error event.
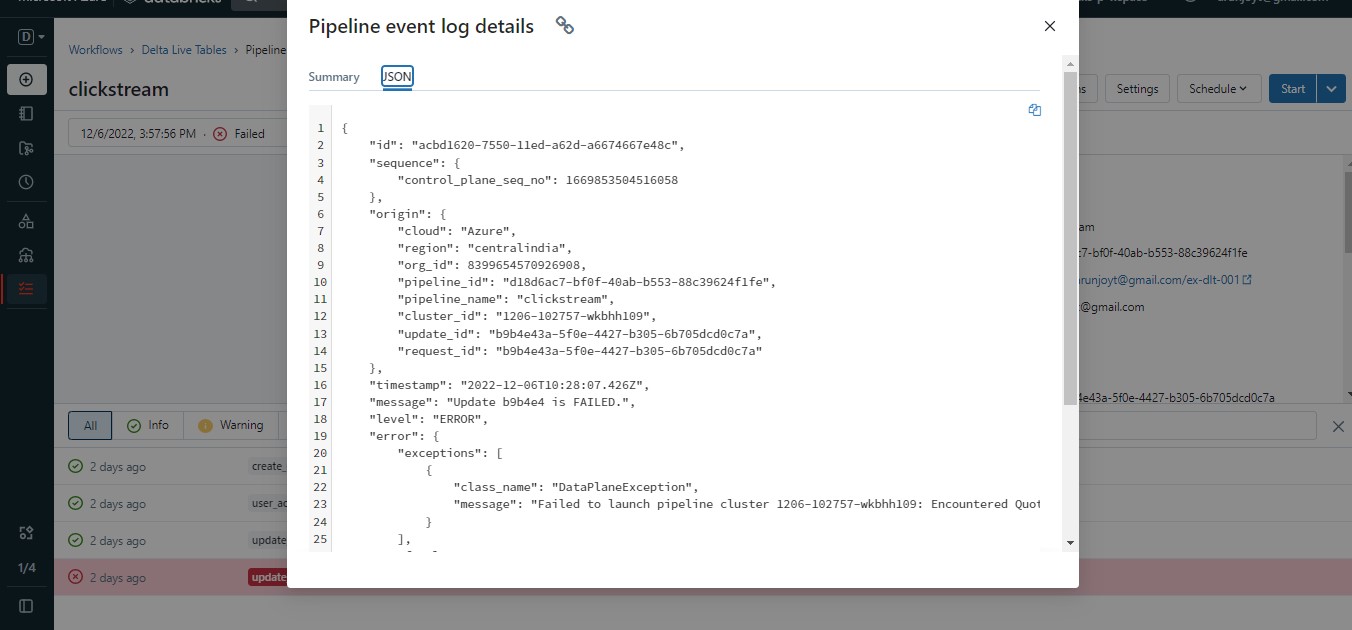
While the UI is excellent for immediate feedback, it only tells part of the story. To perform deep analysis, historical tracking, or automated alerting, you need to query the event log directly.
2. The Event Log: Your Pipeline's Source of Truth
Every action, metric, data quality check, and configuration change in a DLT pipeline is recorded in the event log. This log is not just a text file; it is a Delta table, meaning you can query it with SQL just like any other data table in your lakehouse.
This event log is automatically created and stored in a system/events subdirectory within your pipeline's defined storage location.
To learn about the event log and the standard ways to query it, the official Databricks documentation is the best source.
Pipeline event log | Databricks on AWS
This documentation page, 'Pipeline event log', explains what the event log is and provides the primary methods for querying it.
Please read the introduction and the section 'Query the event log'. Focus on the two main access patterns: using the event_log(<pipelineId>) function and publishing the log to a named table in Unity Catalog.
As the documentation states, you have two primary ways to access the log:
- Using the
event_log()Table-Valued Function (TVF): This is the simplest method for ad-hoc querying. You just need your pipeline's ID.SELECT * FROM event_log('YOUR_PIPELINE_ID'); - Publishing to Unity Catalog: In your pipeline's settings, you can configure it to publish the event log to a specific table in Unity Catalog. This is the best practice for production, as it makes the log discoverable and allows you to manage its permissions like any other data asset.
3. Interpreting the Event Log with SQL
Simply selecting * from the event log reveals that most of the rich information is nested within a details column as a JSON string. To "interpret" the log, you need to parse this JSON. Your experience with SQL and data transformation will be directly applicable here.
Let's explore how to extract meaningful information from this nested structure.
Advancing Spark - Exploring DLT Event Metrics
The video 'Advancing Spark - Exploring DLT Event Metrics' does a fantastic job of showing how to programmatically dissect the event log. It covers the essential techniques for parsing the details column.
Watch from 05:41 to 12:45. Pay close attention to two key techniques: Discovering that the event log is a Delta table in the system/events folder. Using colon (:) notation in SQL to easily query nested fields within the JSON details column (e.g., details:flow_progress.status).
As the video demonstrated, Spark's SQL capabilities make it straightforward to query into the JSON structure. For example, to find the number of output rows for successful data flows, you can write a query like this:
SELECT
  origin.update_id,
  timestamp,
  details:flow_progress.status,
  details:flow_progress.metrics.num_output_rows
FROM event_log('YOUR_PIPELINE_ID')
WHERE
  event_type = 'flow_progress' AND details:flow_progress.status = 'COMPLETED'
Querying Data Quality and Expectations
One of the most powerful use cases for the event log is to monitor data quality trends over time. The results of your DLT expectations are stored within the details:flow_progress:data_quality:expectations field, which is a JSON array.
To analyze this data, you need to flatten the array into rows. This is a classic ETL pattern.
Monitoring DLT Pipeline Performance and Best Practices
The Databricks Community article 'Monitoring DLT Pipeline Performance and Best Practices' provides excellent, ready-to-use SQL queries for common monitoring tasks.
Read the sections 'Event Log' and 'Dissecting the Event Logs using the SQL Editor'. Focus on the SQL query provided that calculates the count of passing and failing records for data quality checks. Notice how it uses from_json and explode to parse the expectations array.
Here is a query, adapted from the article, that summarizes the results of your data quality expectations from the latest pipeline run. This is a powerful template for your own monitoring needs.
-- Find the ID of the latest pipeline update
CREATE OR REPLACE TEMP VIEW latest_update AS
SELECT origin.update_id
FROM event_log('YOUR_PIPELINE_ID')
WHERE event_type = 'create_update'
ORDER BY timestamp DESC
LIMIT 1;

-- Query the data quality metrics from the latest update
SELECT
  expectations.dataset,
  expectations.name AS expectation_name,
  SUM(expectations.passed_records) AS passing_records,
  SUM(expectations.failed_records) AS failing_records
FROM (
  SELECT
    explode(from_json(details:flow_progress:data_quality:expectations, "array<struct<name:string, dataset:string, passed_records:bigint, failed_records:bigint>>")) AS expectations
  FROM event_log('YOUR_PIPELINE_ID')
  WHERE
    event_type = 'flow_progress'
    AND details:flow_progress:data_quality IS NOT NULL
    AND origin.update_id = (SELECT update_id FROM latest_update)
)
GROUP BY
  dataset,
  expectation_name;
This query demonstrates a professional-level pattern:
- Isolating the most recent pipeline run.
- Using
from_jsonto define a schema for the nested JSON array. - Using
explodeto transform each element of the array into its own row. - Aggregating the results to create a summary report.
Conclusion
In this lesson, you've learned the fundamental practices for DLT pipeline observability. You now know how to get a quick status check from the UI and, more importantly, how to dive deep into the event log to extract precise operational metrics.
Key Takeaways:
- UI Monitoring: The DLT UI provides a high-level, real-time view of the pipeline graph, data quality metrics, and a live event stream, making it ideal for quick diagnostics.
- The Event Log as a Delta Table: The event log is the comprehensive source of truth for all pipeline activities and is stored as a queryable Delta table.
- Programmatic Access: You can query the event log using the
event_log()TVF or by publishing it to a named table in Unity Catalog for better governance. - Interpreting with SQL: The key to interpreting the log is parsing the JSON in the
detailscolumn using SQL's dot notation for simple fields and functions likefrom_jsonandexplodefor complex arrays.
Preview of the Next Lesson:
We have now covered how to build, configure, and monitor a DLT pipeline. In the next lesson, we will focus on diagnosing and resolving DLT pipeline failures using the UI, event log, and built-in recovery actions. We'll move from passively observing to actively troubleshooting, using the event log interpretation skills you've just learned to tackle common failure scenarios.