Hello! Let's dive into our next lesson on Delta Live Tables.
In the last session, we focused on building data integrity by implementing DLT expectations. You learned how to define data quality rules and apply different enforcement actions—expect, expect or drop, and expect or fail—to create robust and trustworthy pipelines.
Now that you know how to control the quality of data within a pipeline, we'll turn our attention to controlling the pipeline's execution environment. Today's learning outcome is to configure DLT pipeline settings, including development vs. production mode. This is a fundamental concept for managing pipelines effectively, as it directly impacts iteration speed, reliability, and cost—all critical concerns in a professional data engineering setting.
1. Understanding Development vs. Production Modes
DLT pipelines are designed to operate in two distinct modes, each tailored for a specific stage of the pipeline lifecycle. Choosing the right mode is crucial for both efficient development and stable, cost-effective production runs.
Let's start by getting a clear definition of what these two modes are and how they differ.
Databricks Delta Live Tables (DLT): A Comprehensive Guide to Best ...
This article provides a superb explanation of the Development and Production modes. It clearly outlines the purpose and behavior of each mode, which will form the foundation of our lesson.
Please read the section titled "Modes: Development vs. Production". Focus on the key differences regarding cluster reuse, automatic retries, and cluster termination behavior.
To summarize the key points from the reading:
- Development Mode: Built for interactive development and rapid iteration. It prioritizes speed over cost-efficiency by reusing compute resources.
- Production Mode: Optimized for operational stability, robustness, and cost control in automated, scheduled pipelines.
2. Configuring Pipeline Modes in the UI
Switching between these modes is straightforward in the Databricks UI. You can set the mode when you first create the pipeline or edit the settings of an existing one.
Let's watch a short walkthrough of the DLT pipeline creation UI to see where these settings live.
Databricks Lakeflow Declarative Pipelines are a GAME CHANGER for ETL
This video clip shows the process of creating a DLT pipeline and navigating its settings. Pay attention to the different configuration options presented.
Watch from 04:08 to 06:05 and then from 07:42 to 09:17. Observe the overall settings pane, including where you select the target catalog/schema and find the 'Advanced' options where the pipeline mode is specified.
As you saw in the video, the pipeline mode is a key configuration setting. Once a pipeline is running, you can easily toggle between modes.
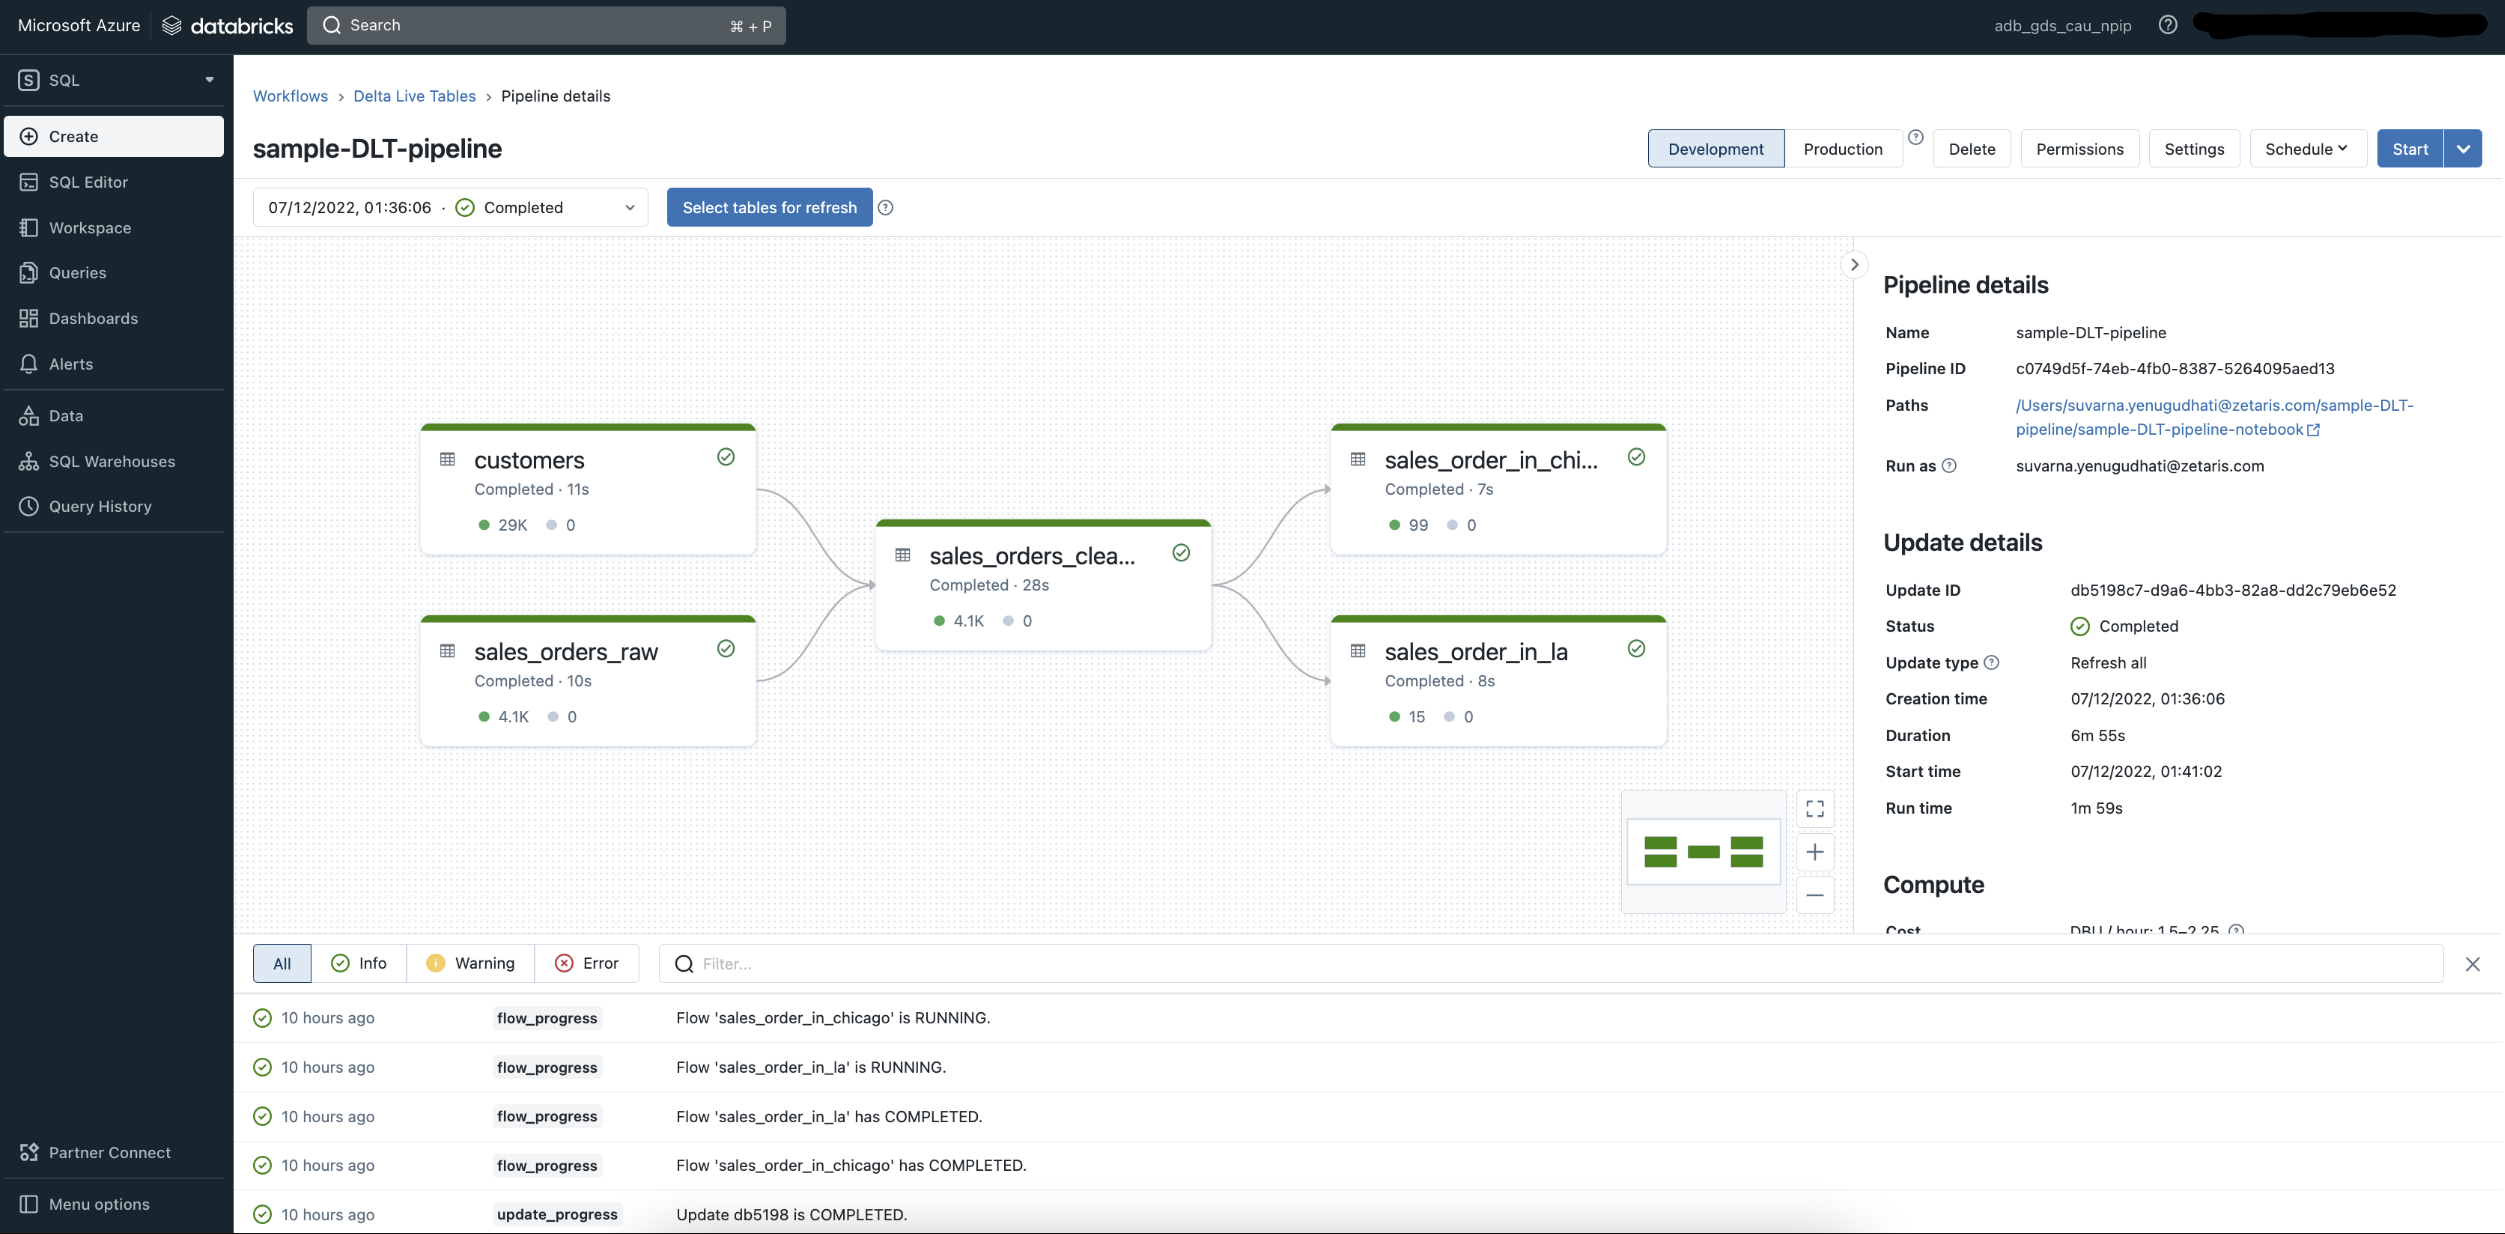
The 'Edit pipeline settings' interface provides more detailed control over the pipeline's configuration.

3. A Deeper Look at the Differences
Let's break down the practical implications of choosing one mode over the other. Your experience with CI/CD and managing infrastructure on AWS/GCP will make these trade-offs very familiar.
| Feature | Development Mode | Production Mode |
|---|---|---|
| Cluster Lifecycle | Reuses the cluster for subsequent runs to provide a fast feedback loop. The cluster remains active for a period (e.g., 2 hours idle) to avoid startup latency. | Starts a new cluster for each pipeline update, ensuring a clean, isolated environment. The cluster terminates immediately upon completion to save costs. |
| Error Handling | Fails immediately on errors. Automatic retries are disabled. This allows you to quickly identify and fix bugs. | Automatically retries transient failures (e.g., cloud provider issues, temporary failures) to enhance pipeline reliability. |
| Cost Implication | Can incur higher costs if idle clusters are not shut down. Optimized for developer productivity, not compute cost. | Optimized for cost-efficiency. You only pay for the compute used during the pipeline run. |
The distinction between these modes is a crucial part of DLT's design, which aims to bring software engineering best practices into the world of data pipelines.
Delta Live Tables A to Z: Best Practices for Modern Data Pipelines
This segment from a Databricks presentation explains the 'why' behind this separation, framing it as a best practice for isolating environments and preventing common mistakes.
Watch from 16:40 to 17:20. The speaker provides a concise explanation of the behavioral differences between the two modes, particularly regarding cluster termination.
Practical Tip: Managing Development Cluster Costs
A common "gotcha" with Development mode is leaving an idle cluster running, which incurs unnecessary costs. You can control this behavior.
Databricks Delta Live Tables (DLT): A Comprehensive Guide to Best ...
This article offers a practical tip for managing costs in development mode by adjusting the cluster shutdown delay.
Find the paragraph that begins with "Another tip: development mode by default keeps clusters alive for 2 hours after use...". This highlights the pipelines.clusterShutdown.delay setting, a useful configuration for your development workflow.
4. Best Practices: Environment Isolation
The true power of the dev/prod separation in DLT is in creating isolated environments. This practice prevents a developer's work-in-progress from accidentally impacting a production dataset. Given your background in deploying and maintaining data platforms, this principle of environment isolation is likely second nature.
DLT facilitates this by allowing you to have different pipeline configurations that point to the same code but publish to different schemas or catalogs. For example:
- A development pipeline runs in
Developmentmode and writes to adev_schema. - A production pipeline runs in
Productionmode and writes to aprod_schema.
This is a core tenet of building reliable data products.
Delta Live Tables A to Z: Best Practices for Modern Data Pipelines
This clip expands on the concept of isolation, explaining how DLT manages dependencies and separates environments even when they share the same codebase. It also introduces the live schema, a key feature for writing environment-agnostic code.
Watch from 01:02:11 to 01:06:15. Focus on how separate DLT pipelines provide isolation and how the live virtual schema enables your code to read from the correct upstream table (dev or prod) based on the pipeline's context.
The live schema is a powerful abstraction. When you write SELECT * FROM live.my_table, DLT automatically resolves this to the correct version of my_table within the currently running pipeline, whether it's your development version or the production one.
5. Under the Hood: The JSON Configuration
While the UI provides convenient toggles, all DLT pipeline settings are defined in a JSON specification. As a developer, it's useful to understand this underlying structure.
The distinction between development and production mode is controlled by a simple boolean flag.
This official documentation serves as a reference for all DLT pipeline settings. We'll look at it to find the specific property that controls the development mode.
Scan the list of "Pipeline configurations" and find the development property. Note that it's a boolean flag and defaults to true.
Here's an example snippet from a DLT pipeline's JSON configuration:
{
  "name": "my_dlt_pipeline",
  "development": false,
  "libraries": [
    {
      "notebook": {
        "path": "/Repos/user@domain.com/my-project/dlt_notebook"
      }
    }
  ],
  "target": "my_production_database"
}
Setting "development": false is how you configure a pipeline for production mode. This is particularly important when you start automating deployments using tools like Databricks Asset Bundles (DABs) or the REST API, topics we will touch on later in the course.
Conclusion
You have now learned how to configure the execution environment of your DLT pipelines by choosing between Development and Production modes. Understanding the trade-offs between them is essential for both building pipelines efficiently and running them reliably.
Key Takeaways:
- Development Mode is for interactive development. It prioritizes speed by reusing clusters and failing fast on errors.
- Production Mode is for operational pipelines. It prioritizes reliability and cost-efficiency with fresh clusters, automatic retries, and immediate shutdown.
- The UI provides a simple toggle to switch between modes, but this is backed by a
developmentflag in the pipeline's JSON configuration. - The best practice is to use separate DLT pipelines for development and production environments, pointing to different target schemas, to ensure complete isolation.
- The
liveschema allows you to write environment-agnostic code that works seamlessly across both development and production pipelines.
Preview of the Next Lesson:
Now that you can build, set quality rules for, and configure a DLT pipeline, the next logical step is to understand what happens when it runs. In the next lesson, we will learn how to monitor DLT pipeline execution and interpret the event log, which is crucial for debugging, performance tuning, and ensuring your pipelines are healthy.