Hello! Welcome back to our sessions on Delta Live Tables.
In our last lesson, we focused on monitoring and observability. You learned how to use the DLT UI for a quick health check and, more importantly, how to query the event log as a Delta table to extract detailed performance and data quality metrics.
Today, we take the next logical step from observation to action. The learning outcome is to diagnose and resolve DLT pipeline failures using the UI, event log, and built-in recovery actions. This is a fundamental skill for any data engineer responsible for production pipelines. We'll establish a practical debugging workflow that starts with a failure notification and ends with a successful pipeline run.
1. The Debugging Workflow: From Red Alert to Green Light
When a DLT pipeline fails, your goal is to identify the root cause and apply a fix as efficiently as possible. The process typically involves three stages:
- Diagnose: Use the DLT UI and event log to find out what went wrong, where, and why.
- Resolve: Correct the underlying issue, which is often a bug in your SQL or Python code.
- Recover: Rerun the pipeline, sometimes using specific recovery actions to ensure data consistency.
Let's break down each stage.
2. Diagnosing Failures: Your First Response
The DLT UI is designed to make the initial diagnosis straightforward. A failed pipeline run will clearly mark the point of failure in the data flow graph.
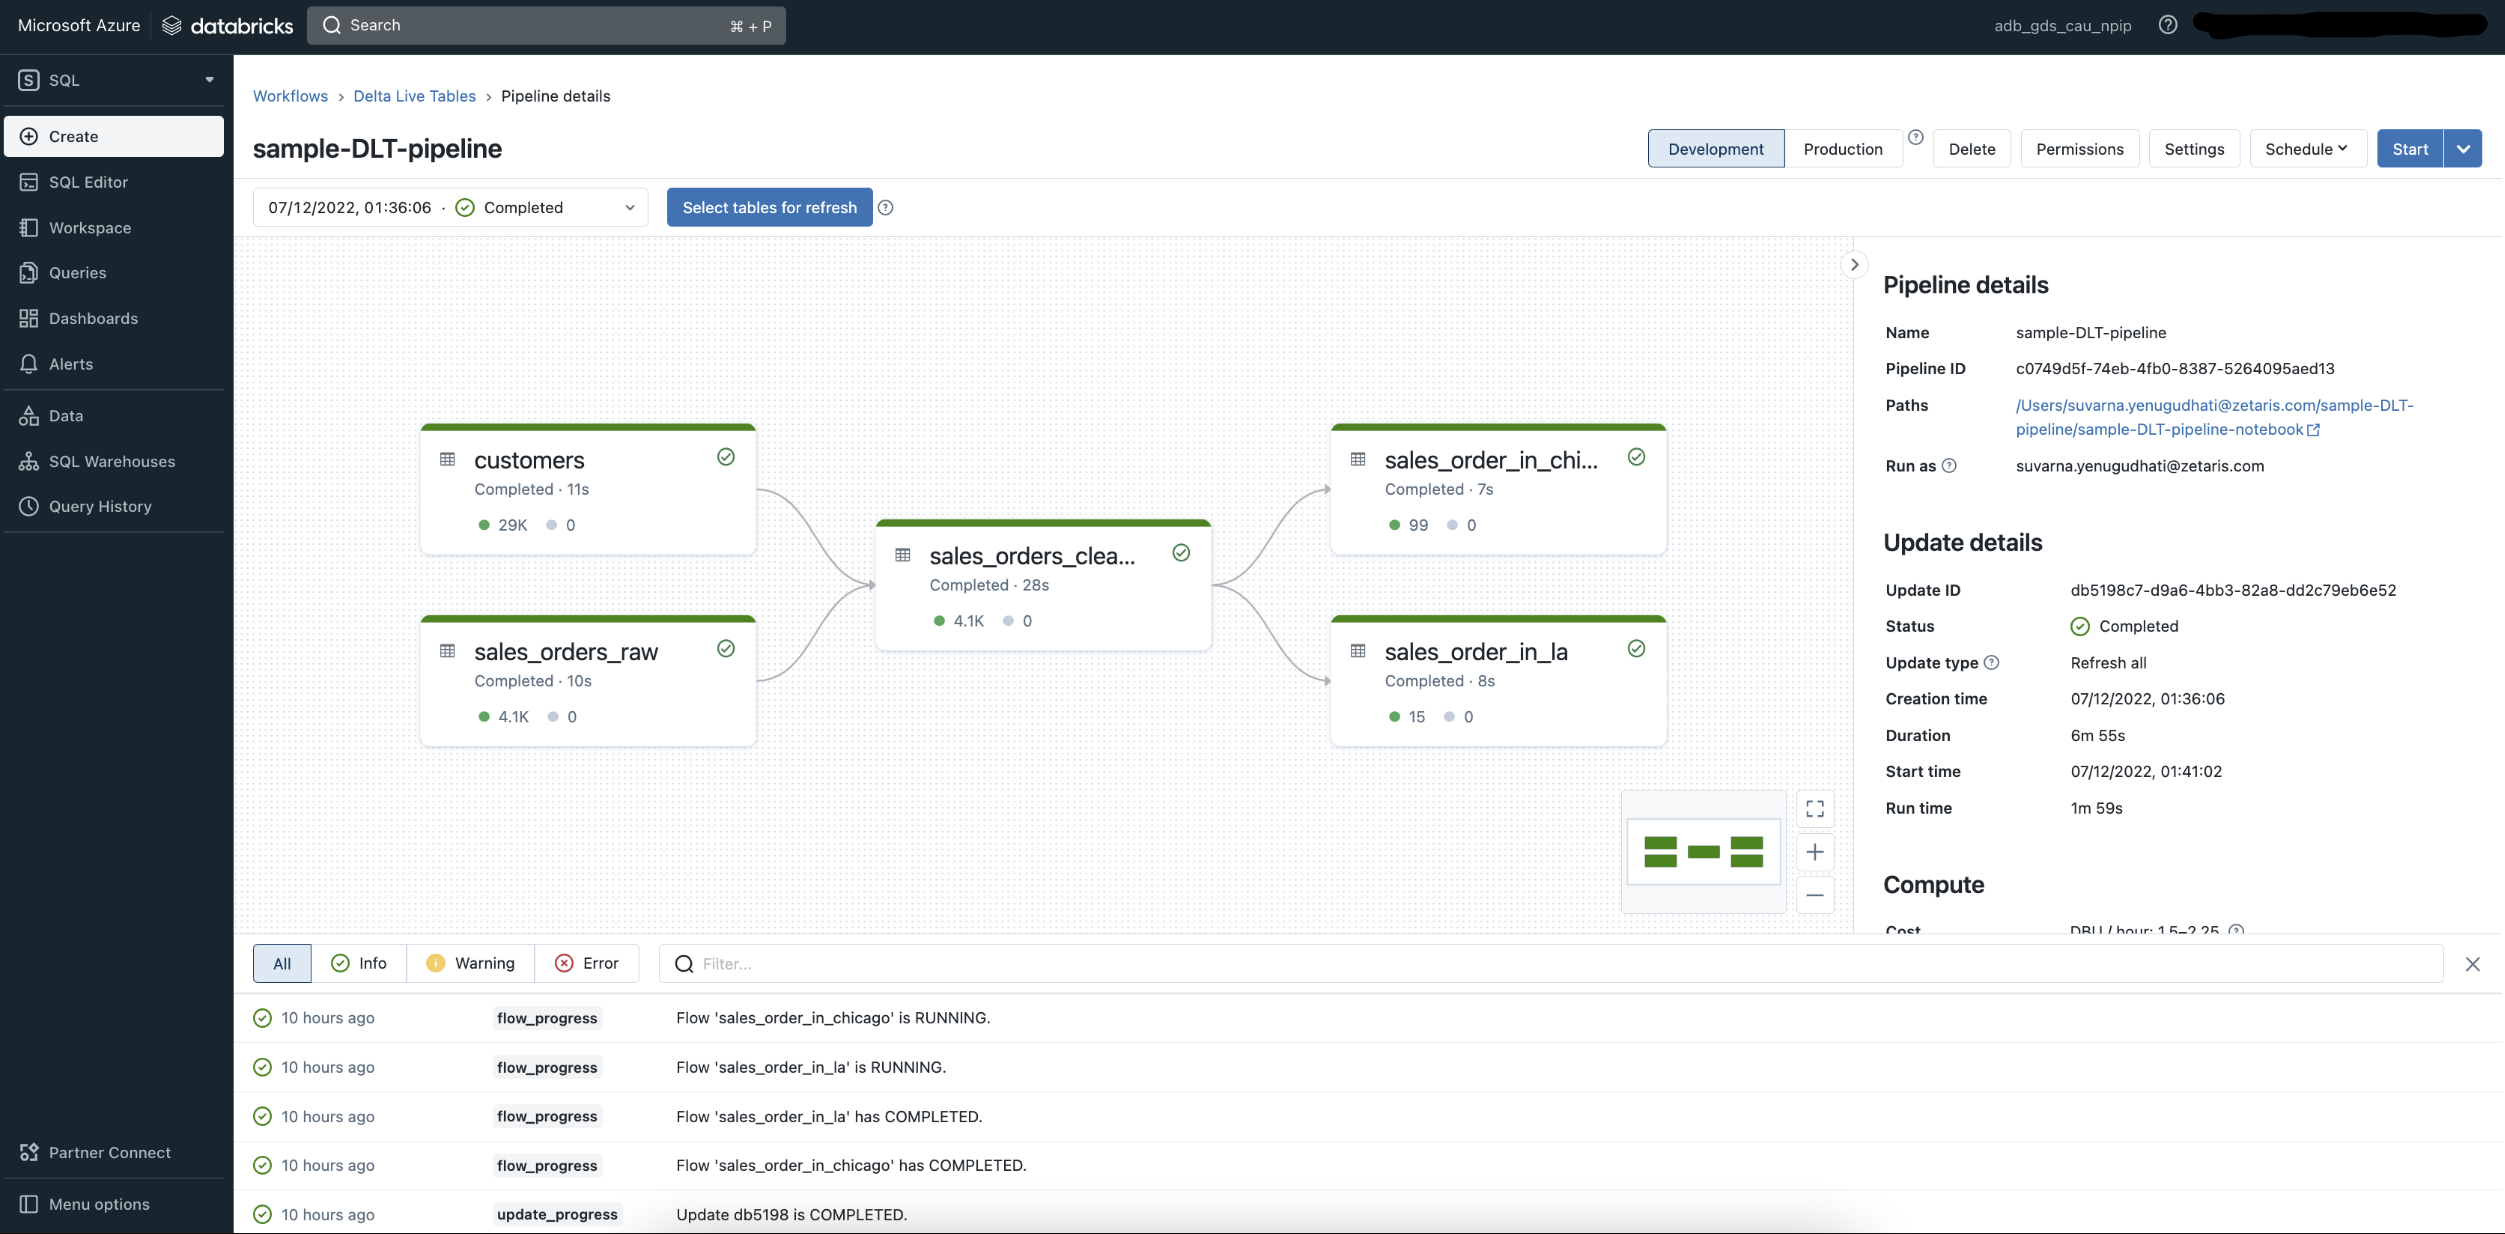
A failure can happen for many reasons. Let's look at a few common scenarios and see how to diagnose them.
30 DLT Data Quality & Expectations | Monitor DLT pipeline using SQL | Define DQ rule |Observability
This video from the 'Ease With Data' channel provides two excellent, concise examples of diagnosing common failures directly from the DLT UI.
Please watch the following two clips: Syntax/Compilation Error (07:03 - 07:37): Notice how the pipeline fails during the INITIALIZING step. The presenter clicks on the failed event to immediately see the error message in the log, which points to an incorrect column name in the code. Data Quality Failure (09:38 - 10:19): Here, the pipeline fails on a specific table because an expect or fail constraint was violated. Again, the event log provides the exact expectation that failed and even shows the problematic record.
As you saw in the video, the diagnostic process is direct:
- Locate the red,
FAILEDnode in the pipeline graph. - In the event log panel, find the corresponding error event.
- Click the event to open the detailed JSON view. The
errorfield contains the stack trace or a clear message explaining the cause, such as a syntax error, a missing column, or a violated data quality constraint.
3. Resolving Failures and Recovering State
Once you've diagnosed the problem, the next step is to fix it. This often involves correcting your SQL or Python code. However, simply fixing the code and rerunning the pipeline might not be sufficient, especially when dealing with schema changes or stateful operations. This is where DLT's recovery actions become essential.
The Full Refresh Recovery Action
The most powerful recovery action is Full Refresh All. This action instructs DLT to:
- Truncate all tables in the pipeline.
- Clear any stateful information (like files processed by Auto Loader).
- Re-process all source data from the beginning.
When to Use Full Refresh:
- During development: After you've changed a table's schema (e.g., added a column, changed a data type) or significantly altered transformation logic.
- To re-evaluate expectations: If you add a new data quality rule, a full refresh ensures it's applied to the entire dataset, not just new data.
- To recover from corrupted state: In rare cases where the pipeline's incremental state becomes inconsistent.
A crucial point for a professional data engineer: use Full Refresh with extreme caution in production. It can be very time-consuming and expensive on large datasets. It's primarily a development and backfilling tool.
The following video demonstrates a perfect real-world scenario where a Full Refresh is the correct solution.
Production-ready end-to-end DLT Pipeline | Databricks DLT
In this video from 'The Data Master', the presenter makes a schema change that initially results in null values. They then use 'Full Refresh' to correctly backfill the new column for all existing records.
Watch from 18:19 to 23:32. Pay close attention to this sequence of events: A new column, injection_date, is added to the transformation logic. After running the pipeline, a query shows the new column is NULL for existing tables because DLT's incremental processing didn't re-run on old data. The presenter initiates a 'Full Refresh All' from the UI. After the refresh completes, a new query confirms the injection_date column is now correctly populated for all records.
This video also highlights other built-in recovery options available in the "Start" button dropdown:
- Refresh Selection: Allows you to select specific tables to be fully refreshed, which is a more surgical and less costly approach than refreshing everything.
- Full Refresh All: The option we've just discussed.
4. Advanced Diagnosis: Querying the Event Log for Failures
While the UI is great for immediate feedback, programmatic analysis of the event log is essential for historical debugging and building automated alerts. In the last lesson, you learned how to query the log. Now, let's focus on queries specific to failures.
The key is to filter for events that indicate a problem. You can start by looking for events where the level is ERROR or the status is FAILED.
SELECT
  timestamp,
  origin.update_id,
  event_type,
  message,
  details
FROM event_log('YOUR_PIPELINE_ID')
WHERE level = 'ERROR'
ORDER BY timestamp DESC
LIMIT 10;
Understanding the Event Log Schema for Failures
To build more precise queries, you need to know what to look for in the details JSON payload. The official documentation on the event log schema is your reference guide.
Pipeline event log schema | Databricks on AWS
This 'Pipeline event log schema' documentation is the dictionary for the event log. It's not for memorization, but for reference. Let's look at the key objects related to failures.
Quickly review the tables describing these objects: Details for flow_progress event: Note the status field. A value of FAILED indicates a problem with a specific table. Details for update_progress event: Note the state field. FAILED or CANCELED here signals a failure of the entire pipeline update. DataQualityMetrics object: The dropped_records field is crucial for silent failures where data disappears due to unmet expectations. IssueType object: This enum provides specific, machine-readable reasons why a materialized view required a full refresh, which helps diagnose performance issues.
With this knowledge, you can write targeted queries. For example, to programmatically find all data quality failures for your pipeline, you can use a query like the one shown in this next video segment.
30 DLT Data Quality & Expectations | Monitor DLT pipeline using SQL | Define DQ rule |Observability
This clip, again from 'Ease With Data', demonstrates how to query the event log programmatically to find the exact number of passing and failing records for each data quality expectation.
Watch from 14:32 to 17:18. The presenter shows how to: Get the pipeline ID from the UI. Use the event_log() function in a separate notebook. Create views over the raw log and latest updates. Run a pre-built query (similar to the one from our last lesson) to get a summary of data quality failures. This is a powerful pattern for creating monitoring dashboards.
This approach allows you to move beyond reactive debugging and into proactive monitoring, which is a hallmark of a senior data engineer.
Conclusion
In this lesson, you have learned a systematic approach to handling failures in Delta Live Tables. You can now confidently diagnose issues, apply the correct resolution, and use recovery actions to restore your pipeline to a healthy state.
Key Takeaways:
- Standard Debugging Workflow: Use the UI to spot failures, inspect the event log for the root cause, fix the code, and rerun the pipeline.
- UI for First Response: The DLT graph and event log stream are your primary tools for immediate diagnosis of syntax, data, or configuration errors.
Full Refreshfor Recovery: This powerful action truncates tables and re-processes all data. It's invaluable during development for schema changes and backfills but should be used with caution in production.- Event Log for Deep Diagnosis: Querying the event log with SQL allows you to analyze historical failures, track data quality issues over time, and build automated monitoring solutions by filtering for error events and parsing the
detailscolumn.
Preview of the Next Lesson:
We have now completed our deep dive into the mechanics of Delta Live Tables. In the next module, we will shift our focus to architectural patterns. The first lesson will be "Identify the layers of the Medallion Architecture and map a sample data flow through bronze, silver, and gold." You'll learn how to apply the DLT framework to build robust, multi-layered data pipelines that are clean, reliable, and ready for business intelligence and machine learning.