Introduction
In our previous lesson, we established the crucial link between Unity Catalog and your physical cloud storage by configuring storage credentials and external locations. This gave you the power to govern data stored in your own S3 buckets.
Now that we have data under management, the next logical question for any data engineer is: "Where did this data come from, and where is it going?" Answering this question is the essence of data lineage. Today's lesson focuses on exactly that. Our learning outcome is to trace data lineage across tables and pipelines using Unity Catalog.
We will explore how Unity Catalog automatically captures and visualizes the flow of data—from raw source tables, through various transformations in notebooks and jobs, all the way to final aggregated tables and dashboards. Understanding lineage is not just an academic exercise; it's a critical skill for debugging pipeline failures, performing impact analysis before making changes, and ensuring data quality and compliance.
1. What is Data Lineage in Unity Catalog?
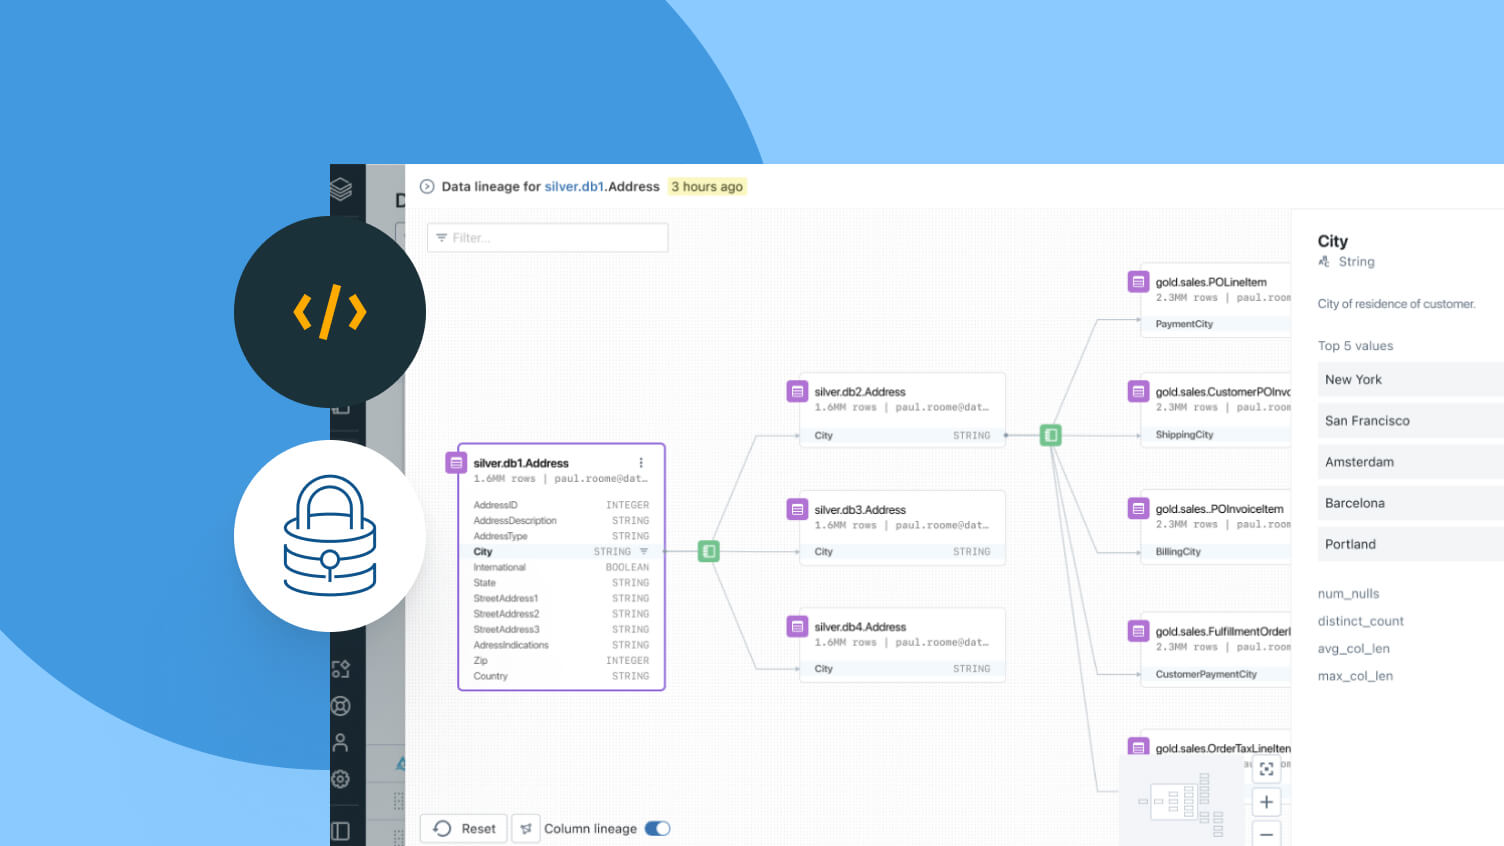
At its core, data lineage is a map that shows the journey of your data. It illustrates the relationships and dependencies between your data assets. Instead of being a static, manually drawn map, Unity Catalog's data lineage is generated automatically and in near real-time as your queries and jobs run.
Key features of Unity Catalog's data lineage include:
- Automatic Capture: Lineage is captured for all languages supported by Databricks (SQL, Python, Scala, R) without requiring any manual annotation.
- Column-Level Granularity: It doesn't just track which tables feed into other tables; it tracks lineage down to the individual column. You can see exactly which source columns were used to create a derived column.
- End-to-End Visibility: The lineage graph connects not just data assets (tables, views) but also the operational assets that transform them, such as notebooks, jobs, and dashboards.
For lineage to be captured, there are a few important requirements you need to keep in mind.
View data lineage using Unity Catalog
The official Databricks documentation, 'View data lineage using Unity Catalog,' clearly outlines the conditions necessary for lineage capture. Understanding these is the first step to ensuring your pipelines are fully tracked.
Read the 'Requirements' section. Pay close attention to the types of tables (must be in Unity Catalog) and the query interfaces (Spark DataFrame or Databricks SQL) that support lineage capture. Note the Databricks Runtime versions required for streaming and column-level lineage.
2. Hands-On: Exploring Lineage in the Catalog Explorer
The most intuitive way to start exploring data lineage is through the visual interface in the Catalog Explorer. Let's look at a practical scenario for using it.
Automated Data Lineage with Unity Catalog
The official Databricks channel has a short, focused video, 'Automated Data Lineage with Unity Catalog,' that demonstrates how lineage can be used to debug a data quality issue. This provides excellent context for why this feature is so valuable.
Watch from 00:56 to 03:56. Observe how the data engineer navigates from a problematic table to its upstream sources, first at the table level and then at the column level. Notice how the lineage graph also includes the job that populates the table, leading directly to the root cause of the issue.
As you saw in the video, the lineage graph is an interactive tool for investigation. Now, let's walk through the steps to do this yourself.
Assume you have a series of tables created in your workspace, such as a bronze table ingesting raw data, a silver table for cleansed data, and a gold table for aggregation.
To explore the lineage:
- Navigate to a Table: Go to the Catalog explorer in your Databricks workspace and select a table (for example, your gold-level aggregated table).
- Select the Lineage Tab: Click on the Lineage tab. You will see two initial panels showing immediate upstream and downstream tables.
- Open the Lineage Graph: Click the See Lineage Graph button to open the full interactive visualization.
- Explore the Graph:
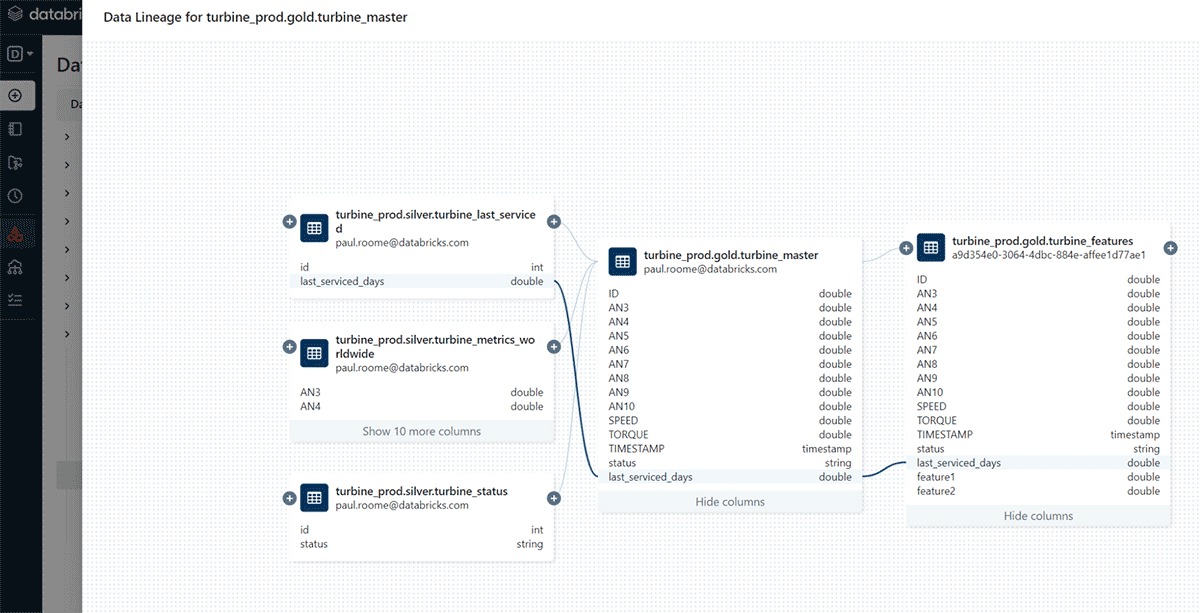
- The graph shows your selected table in the center. Upstream tables (sources) are on the left, and downstream tables (consumers) are on the right.
- Click the (+) icon on any node to expand the graph and see its dependencies. This "neighborhood view" approach helps manage complexity.
- Click on an arrow connecting two nodes to see details about the transformation, including the notebook or job responsible.
- View Column-Level Lineage:
- Within the lineage graph, expand the schema of a table by clicking the icon showing columns.
- Click on a specific column name. The graph will highlight the path for that column, showing you exactly where it originated.
This visual exploration is powerful for data discovery and root-cause analysis.
3. Programmatic Access: Lineage for the Data Engineer
While the UI is great for exploration, as a data engineer, you often need to access metadata programmatically for automation, custom monitoring, or large-scale impact analysis. Unity Catalog provides two primary ways to do this: System Tables and the REST API.
Using System Tables
System tables are a special, read-only schema (system.access) within Unity Catalog that exposes operational metadata. For lineage, there are two key tables:
system.access.table_lineagesystem.access.column_lineage
These tables allow you to query lineage relationships using standard SQL. This is an incredibly powerful feature for building custom governance and observability solutions.
Databricks Data Lineage - API, Tables, Unity Catalog
The blog post 'Databricks Data Lineage' from Sonra provides excellent, practical SQL examples for querying these system tables. It also points out an important prerequisite: you must enable the system schema first.
Read the section titled 'Data lineage in System tables'. Note the names of the two lineage tables. Pay special attention to the example that joins table_lineage with query_history to retrieve the actual SQL statement that created the dependency. This is a common and very useful pattern.
Here's an example of a query you could run to find all direct downstream consumers of a specific table:
SELECT
  target_table_full_name
FROM
  system.access.table_lineage
WHERE
  source_table_full_name = 'my_catalog.my_schema.my_source_table';
By joining with system.query.history on entity_run_id = statement_id, you can even retrieve the exact query that created the lineage, providing full context for the dependency.
Using the REST API
For integrations with external tooling or in environments where system tables might not be available, Databricks also provides a REST API for lineage. You can make GET requests to endpoints like /api/2.0/lineage-tracking/table-lineage to retrieve upstream and downstream information for a given table or column. This returns a JSON payload detailing the dependencies, which is ideal for programmatic parsing in scripts or applications.
4. Permissions and Limitations
It's important to understand that what you see in the lineage graph is governed by your permissions.
-
Permissions Model: You will only see tables and other objects in the lineage graph if you have at least the
BROWSEorSELECTprivilege on them. If you lack permission for an upstream or downstream table, it will appear as a "masked" node in the graph, and you won't be able to see its details or expand it further. This ensures that data lineage adheres to the same security model as the rest of Unity Catalog. -
Known Limitations: While powerful, the native lineage feature has some limitations you should be aware of, especially for the Professional certification exam.
- "Neighborhood View": The UI and API both operate on a "one hop" basis, showing only immediate neighbors. To trace a multi-step pipeline, you have to expand each node interactively or write recursive queries against the system tables.
- DML/DDL Coverage: Lineage is not captured for
UPDATE,DELETE, orINSERT ... VALUESoperations. It is fully supported forCREATE TABLE AS SELECTandINSERT ... SELECT. Lineage forMERGEoperations must be explicitly enabled via a Spark configuration (spark.databricks.dataLineage.mergeIntoV2.enabled).
Conclusion
In this lesson, we demystified data lineage in Unity Catalog. You learned how it automatically provides a map of your data's journey, enabling powerful use cases like impact analysis and root-cause debugging.
Key Takeaways:
- Unity Catalog automatically captures table and column-level lineage for all queries run on Databricks.
- The lineage graph in Catalog Explorer provides an interactive, visual way to explore data dependencies between tables, notebooks, jobs, and dashboards.
- For automation and advanced analysis, you can programmatically query lineage data using System Tables (
table_lineage,column_lineage) with standard SQL. - The REST API offers another programmatic method for integrating lineage information with external tools.
- Lineage visibility is governed by your Unity Catalog permissions on the underlying data objects.
Preview of the Next Lesson:
We have now covered how to grant permissions on tables and how to trace their lineage. The next step in granular governance is to control what data within a table a user can see. In our next lesson, we will implement dynamic views for row-level and column-level security, allowing you to create a single secure view that shows different results to different users based on their identity or group membership.