Introduction
Hello! Welcome to the first lesson in our module on Optimal Trade Entry and Execution.
In our last module, you learned how to synthesize market structure, liquidity, and the Power of 3 to formulate a daily price narrative. This gives you a powerful framework for anticipating where price is likely to go (your daily bias) and the general path it will take (Accumulation, Manipulation, Distribution).
Now, we need to add a crucial layer of precision. Once you anticipate the true move of the day (the distribution phase), how do you find a high-probability, low-risk entry? That is the question we will begin to answer today.
This lesson introduces the Optimal Trade Entry (OTE) pattern. The OTE is one of ICT's cornerstone concepts, designed to identify the ideal price zone for entering a trade during a retracement. Specifically, we will focus on the first step: defining the OTE zone using specific Fibonacci levels. By the end of this lesson, you will know exactly which Fibonacci levels are used, how to set up your tool, and how to draw the zone on a price chart.
1. What is an Optimal Trade Entry?
At its core, the Optimal Trade Entry is a systematic way to enter a trade during a price pullback or retracement. After an impulsive move in the direction of the trend, price rarely continues in a straight line. It often retraces to a more "efficient" price before resuming its original trajectory. The OTE pattern uses the Fibonacci retracement tool to pinpoint the specific area where this reversal is most likely to occur.
This concept ties directly back to what you learned in Module 4 about Premium and Discount.
- In a bullish trend, we want to buy at a discount. The OTE helps us identify a deep discount level within a retracement.
- In a bearish trend, we want to sell at a premium. The OTE helps us identify a deep premium level.
Let's begin with a quick reading to formalize this idea.
What Is the OTE Strategy? Optimal Entry & Key Fibonacci Levels in ICT
This article from TradingFinder gives a concise overview of the OTE strategy and its purpose.
Please read the introduction and the section 'What Is OTE (Optimal Trade Entry)?'. Focus on how the OTE is designed to find entry points with the highest probability and lowest risk during price pullbacks.
As the article highlights, the OTE setup allows for entries with precision, which is a key goal for any trader. Now, let's get into the specific numbers that make this possible.
2. The Key Fibonacci Levels for OTE
The power of the OTE pattern comes from its use of specific, non-standard Fibonacci levels. While many traders use the 38.2% or 50% levels, ICT focuses on a deeper retracement zone.
The video below clearly defines the zone and the key levels within it.
The Only Video You Will Ever Need on OTE | Master the ICT Optimal Trade Entry Strategy | ICT Series
Let's look at the exact numbers. This video from The day Trading Channel introduces the levels that form the ICT Optimal Trade Entry.
Watch from 00:53 to 01:19. The presenter will define the 'Optimal Trade Zone' (OTZ) and the specific 'Optimal Trade Entry' (OTE) level.
To summarize and clarify, the key ICT Fibonacci levels for identifying an entry are:
- 0.5 (50%): This is the Equilibrium level, marking the midpoint of a price range. It's the dividing line between premium and discount.
- 0.62 (62%): This is the shallowest level and marks the start of the high-probability entry zone.
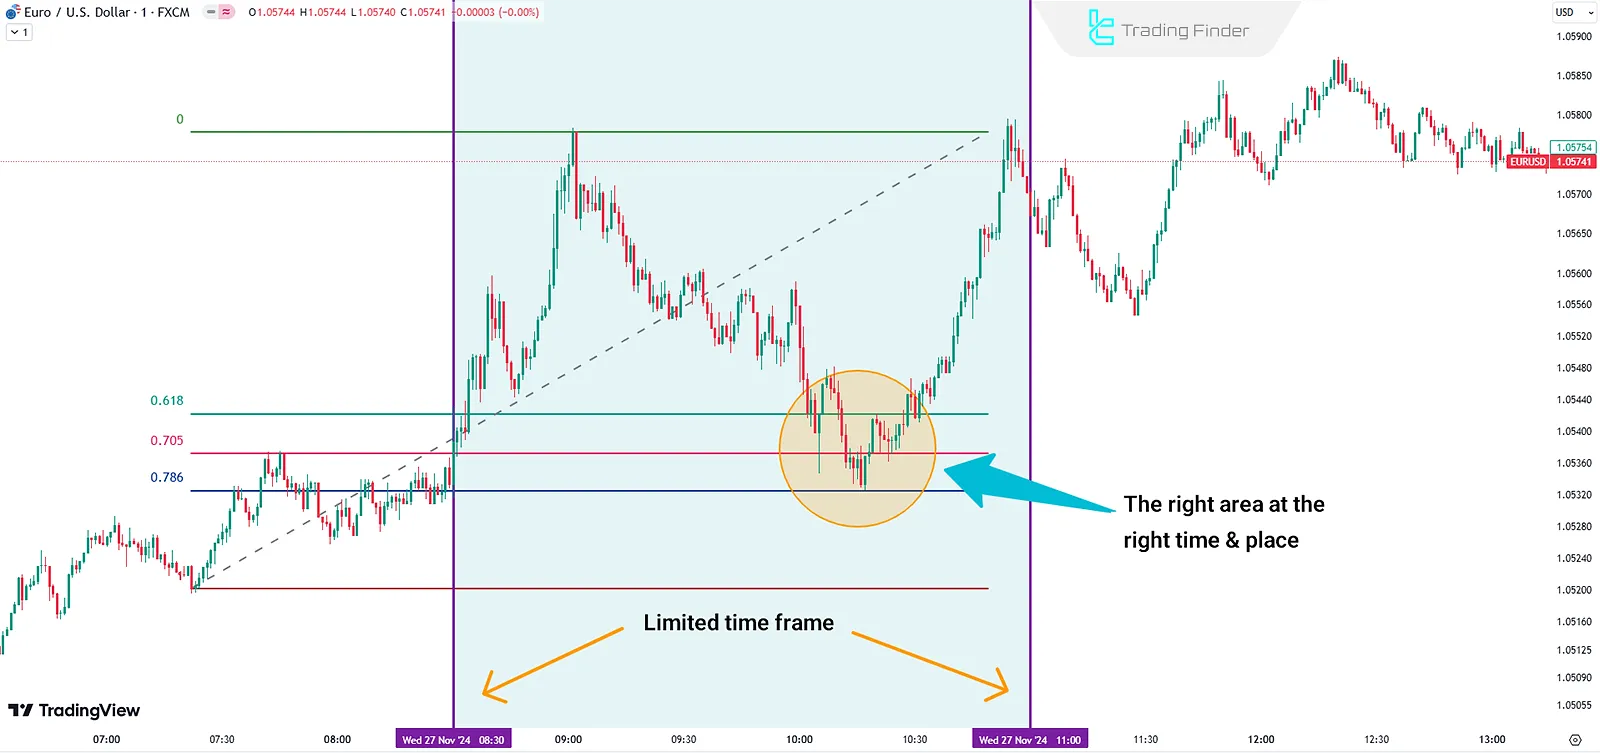
- 0.705 (70.5%): This is considered the "sweet spot" and is referred to as the Optimal Trade Entry (OTE) level.
- 0.79 (79%): This marks the deepest part of the zone. Retracements beyond this point become less probable.
Therefore, the Optimal Trade Entry Zone is the area between the 62% and 79% retracement levels. The 70.5% level is considered the most ideal entry point within that zone.
The following resource provides a handy table listing all the Fibonacci levels ICT uses, including those for profit targets which we will cover later. For now, focus on the entry levels we've just discussed.
ICT Fibonacci Levels - Fib Setting
This article from the innercircletrader.net website provides an authoritative list of the Fibonacci levels used by ICT.
First, review the table under the heading 'What are ICT Fibonacci Levels' to see the full set of levels. Then, read the section 'Ideal Fibonacci Retracement Levels for Trade Entry?' to reinforce the importance of the 62%, 70.5%, and 79% levels.
3. Setting Up and Drawing the OTE Zone
Knowing the levels is the first step. Now, you need to apply them to your chart. This involves two practical skills:
- Configuring your Fibonacci tool with the correct ICT levels.
- Drawing the tool on the correct price swing.
Configuring Your Tool
Most charting platforms, like TradingView, allow you to customize the levels on your Fibonacci retracement tool. You will need to add 0.62, 0.705, and 0.79 to your settings.
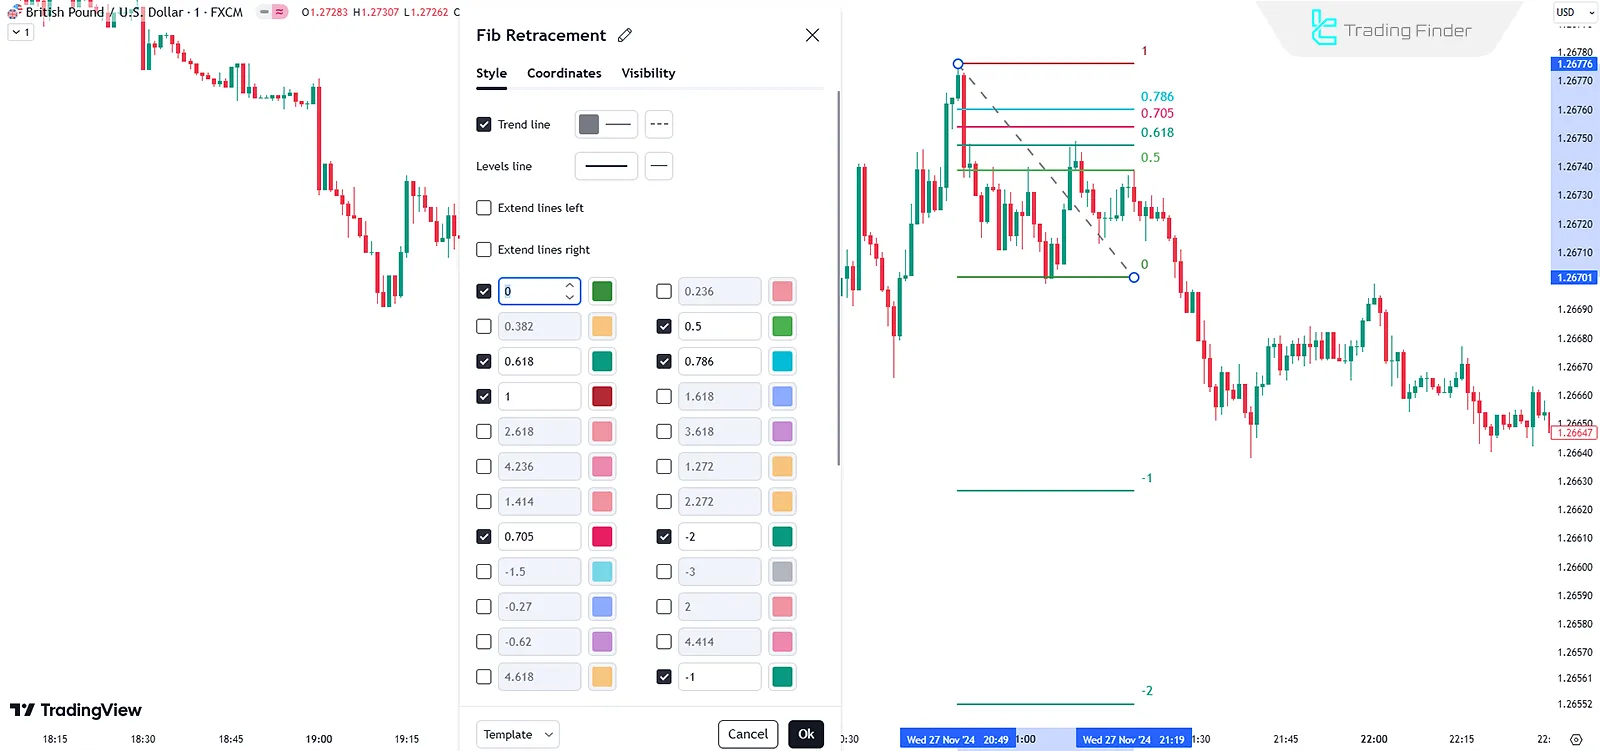
The following video demonstrates this setup process and the correct way to draw the tool.
Optimal Trade Entry (OTE) - ICT Concepts
This video by TTrades provides a clear, practical guide to setting up your Fibonacci tool and drawing it correctly on a price swing.
Watch from the beginning to 02:54. The first part (until 01:16) shows the settings in TradingView. The second part demonstrates the most important rule for drawing the tool: from high to low in a bearish scenario, and from low to high in a bullish one.
Drawing Rules Summary
As the video showed, the rule for drawing the Fibonacci range is simple but crucial:
- For a bullish OTE (expecting the price to go up), you are measuring the retracement of an upward move. Draw the tool from the Swing Low (1) to the Swing High (0). You will be looking for price to retrace down into the OTE zone.
- For a bearish OTE (expecting the price to go down), you are measuring the retracement of a downward move. Draw the tool from the Swing High (1) to the Swing Low (0). You will be looking for price to retrace up into the OTE zone.
Conclusion
In this lesson, you've been introduced to a foundational tool in the ICT toolkit. You are no longer just looking at pullbacks; you are now able to precisely define the high-probability zone where a pullback is likely to end and the trend is likely to resume.
Key Takeaways:
- The Optimal Trade Entry (OTE) is a high-probability entry pattern that uses the Fibonacci tool to find entries in deep retracements.
- The OTE Zone is the price area between the 62% and 79% Fibonacci retracement levels.
- The 70.5% level is considered the ideal entry point, or the "sweet spot," within that zone.
- To identify a bullish OTE, you draw the Fibonacci tool from a swing low to a swing high. For a bearish OTE, you draw from a swing high to a swing low.
Preview of the Next Lesson:
Defining the zone is the first step. In our next lesson, "Identify OTE setups within retracements of impulsive price moves," we will build on this foundation. You'll learn how to identify the valid impulsive price moves that are worthy of measuring for an OTE and begin to see how this pattern appears in the context of the live market.