Hello! Welcome to the final lesson of our module on The Power of 3 and Daily Bias.
Introduction
In our previous lessons, we've built a solid foundation. You've learned to:
- Formulate a daily bias by analyzing higher timeframe structure and liquidity.
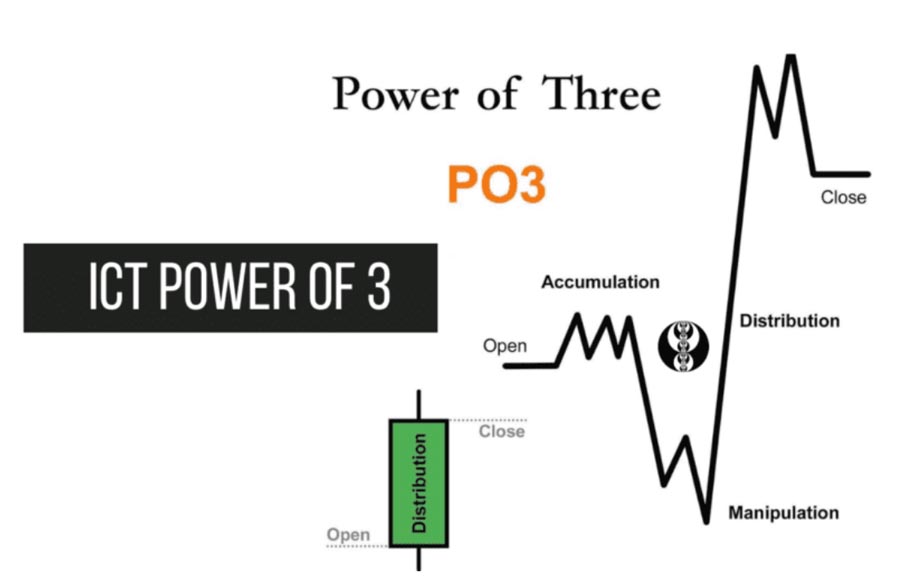
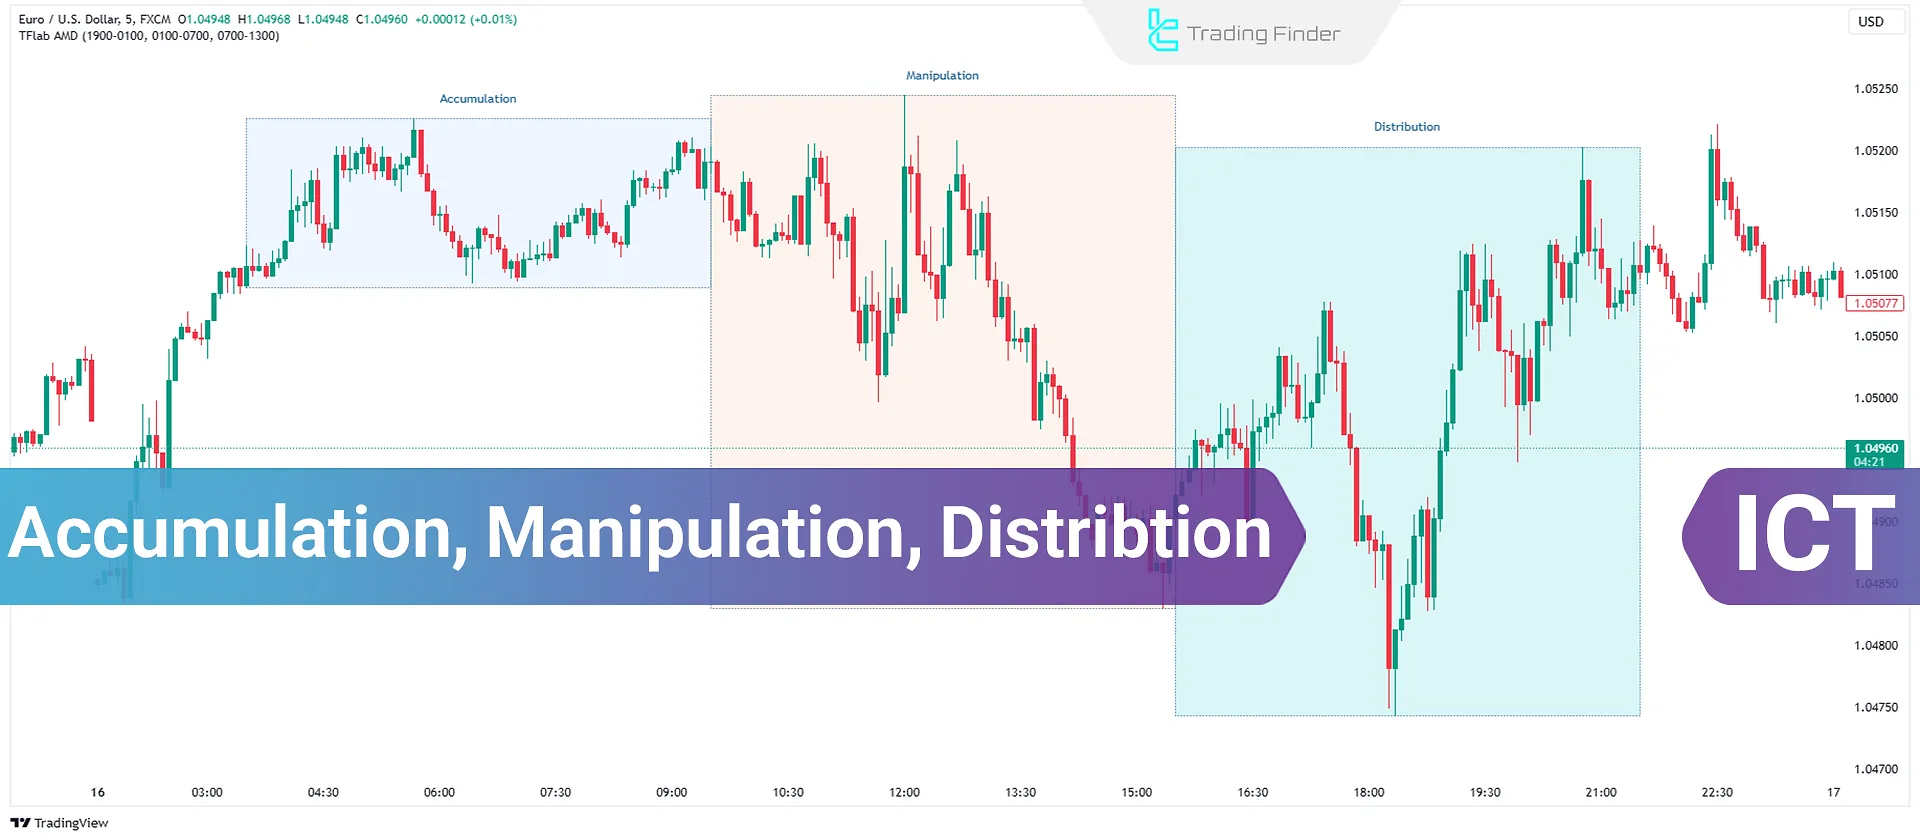
- Identify the three phases of the Power of 3: Accumulation, Manipulation, and Distribution (AMD).
- Relate these AMD phases to the daily timeline using Killzones, understanding that the Asian session often serves as accumulation, London as manipulation, and New York as distribution.
Today, we bring all these elements together. This lesson is about synthesis—combining your daily bias with your understanding of the Power of 3 to create a cohesive daily price narrative. This means moving beyond just identifying patterns and starting to anticipate the story of the trading day before it unfolds.
By the end of this lesson, you will be able to formulate a predictive hypothesis for the daily price action, outlining where you expect price to go (your bias) and the probable path it will take to get there (the AMD cycle).
1. The Importance of a Daily Narrative
Before diving into the mechanics, it's crucial to understand why we're doing this. Trading without a daily narrative is like navigating without a map; you're reacting to every turn without a destination in mind. A daily narrative provides that context, helping you filter out noise and focus only on setups that align with your hypothesis.
Let's begin with a reading that defines the role of daily bias in forming this narrative.
How To Identify Daily Bias Using ICT Concepts
This article from City Traders Imperium clearly explains that daily bias isn't merely about predicting if a candle will close up or down. It's about anticipating the market's path as it seeks liquidity.
Please read the initial two sections: 'Key Findings' and 'What is Daily Bias, and Why Does It Matter?'. Focus on how a well-defined bias provides clarity, confidence, and a filter against low-quality setups.
As the article states, a good daily bias helps you anticipate manipulation and trade in alignment with institutional order flow. When you combine this with the Power of 3, you create a powerful predictive model.
2. Weaving the Narrative: Bias + Power of 3
The daily narrative is built on two fundamental questions:
- Where is price likely going today? (The Daily Bias)
- How is it likely to get there? (The Power of 3 Sequence)
Here is the core logic:
- If you have a BULLISH daily bias, you anticipate a Bullish Power of 3 sequence. This means you expect price to open, manipulate downwards to take sell-side liquidity (the Judas Swing), and then distribute upwards for the true expansion move. The daily candle profile would be an Open-Low-High-Close (OLHC).
- If you have a BEARISH daily bias, you anticipate a Bearish Power of 3 sequence. You expect price to open, manipulate upwards to take buy-side liquidity, and then distribute downwards. The daily candle profile would be an Open-High-Low-Close (OHLC).
3. A Practical Framework for Building the Narrative
Now let's get into a practical, step-by-step process. The following video provides an excellent, simplified method for executing this entire framework, from setting the bias to identifying the entry trigger.
Step 1: Establish the Daily Bias
First, you need a clear directional bias for the day. While we've discussed using higher timeframe market structure, this video introduces a simple and effective three-candle pattern on the daily chart.
I Simplified ICT PO3 Trading Strategy...
This video by Faiz SMC on YouTube provides a very clear, actionable method for trading the Power of 3. We'll use it as our guide for this section. Let's start with his technique for setting the daily bias.
Watch from 00:53 to 04:44. The presenter explains how to use the first two daily candles of a three-candle sequence to establish a bias for the third day. Pay close attention to the two conditions for a bullish and bearish bias based on how the second candle interacts with the first candle's high and low.
To summarize the video's bias rules:
- Bullish Bias: The second candle either closes above the first candle's high, OR it wicks below the first candle's low and then closes back above it. This shows strength and an unwillingness to stay lower.
- Bearish Bias: The second candle either closes below the first candle's low, OR it wicks above the first candle's high and then closes back below it. This shows weakness and a failure to hold higher prices.
Step 2: Anticipate the Manipulation (Judas Swing)
Once you have your bias, you can anticipate the manipulation. Remember, the manipulation is a false move against your bias, designed to engineer liquidity.
Step 3: Pinpoint a Valid Manipulation
The most critical skill is knowing when the manipulation has likely ended and the true distribution is about to begin. A valid manipulation has a clear purpose: to sweep a significant pool of liquidity.
Let's return to the video to see how to identify this on a lower timeframe.
I Simplified ICT PO3 Trading Strategy...
How do you distinguish the real manipulation from random noise? The key is to see it take out a clear level of liquidity. Let's see how this is done.
Watch the segment from 04:44 to 08:44. The presenter explains that after marking the daily opening price, you should look to the left on your chart for significant liquidity (e.g., previous session highs/lows, equal highs/lows). A valid manipulation will sweep that specific level before reversing.
By waiting for this liquidity sweep, you gain confirmation that the manipulation has likely achieved its goal, and the market is now primed to begin the true move of the day—the distribution.
Step 4: Putting It All Together - Full Examples
The final step is to see this entire process play out on the charts. The same video provides complete, narrated examples for both bullish and bearish daily narratives.
I Simplified ICT PO3 Trading Strategy...
Let's watch the full process from start to finish. These examples will walk you through identifying the bias, spotting the manipulation, and framing an entry for the distribution.
Watch from 09:18 to the end (16:07). For each example (both bullish and bearish), follow the presenter's steps: Set the Bias on the Daily chart. Mark the Opening Price on the 15-minute chart. Identify the Liquidity Pool to the left of the open. Watch the Manipulation sweep that liquidity. Look for an Entry Confirmation (like a market structure shift) as the distribution phase begins.
Watching these examples should solidify the entire process in your mind. This is the synthesis of time, price, and liquidity that forms the foundation of ICT's approach to day trading.
Conclusion
Congratulations on completing this module! You have now assembled a complete framework for anticipating the daily price narrative. You are no longer just reacting to price movements; you are starting your day with a clear, logical hypothesis based on institutional concepts.
Key Takeaways:
- The daily price narrative is a hypothesis that combines your daily bias (where price is going) with the Power of 3 (how it will get there).
- A bullish bias anticipates a manipulation down before a distribution up (OLHC). A bearish bias anticipates a manipulation up before a distribution down (OHLC).
- The key to timing your entry is to wait for the manipulation phase to complete its objective: sweeping a significant pool of liquidity from a prior session.
- After the liquidity sweep, you can look for lower-timeframe confirmations like a Market Structure Shift to signal the start of the distribution phase.
Preview of the Next Module:
You now have a robust framework for knowing where and when to look for high-probability trade setups. The next logical question is, "What is the precise entry signal?" In our next module, we will introduce the Optimal Trade Entry (OTE) pattern. This will give you a specific, Fibonacci-based tool to find high-precision entries within the distribution phase you've just learned to anticipate.