Hello! Welcome to the next lesson in our journey through the Power of 3.
Introduction
In our last few lessons, you've learned to identify the three distinct phases of the daily price cycle: Accumulation, Manipulation, and Distribution. You understand what these phases are and why they happen. We also have a solid understanding of Killzones from Module 7—the specific time windows when institutional activity is highest.
Today, we will synthesize these two critical concepts. This lesson bridges the gap between the price action (Power of 3) and the time element (Killzones). You will learn to anticipate when each phase of the AMD cycle is most likely to occur, transforming the Power of 3 from a simple pattern into a time-based roadmap for the trading day.
By the end of this lesson, you will be able to relate the Accumulation, Manipulation, and Distribution cycle to the Asian, London, and New York killzone windows, giving you a powerful framework to anticipate the daily price narrative.
1. The Core Idea: Time and Price Theory
At its heart, ICT methodology is built on Time and Price Theory. The core idea is that significant price moves don't happen randomly; they are engineered to occur at specific times of the day. The Power of 3 is the "price" component, and Killzones are the "time" component. Let's start with a reading that explicitly makes this connection.
Forex Trading Sessions in EST: ICT Trading Guide - Defcofx
This article from Defcofx, 'Forex Trading Sessions in EST', gets right to the point. It defines the ICT killzones and immediately links them to the Power of Three concept.
Please read the section titled 'Understanding ICT Kill Zones in EST'. Pay close attention to how the text directly states that killzones are the windows where smart money executes the Accumulation, Manipulation, and Distribution cycle.
As the text highlights, the alignment of the AMD cycle with specific killzones is not a coincidence; it is the blueprint for institutional order flow.
2. The Standard Daily Blueprint: AMD Across Killzones
While every day is unique, there is a standard template for how the Power of 3 unfolds across the major trading sessions. Understanding this blueprint gives you a baseline expectation for the daily narrative.
-
Asian Session (8 PM - 12 AM EST): The Accumulation Phase
The Asian session is typically a period of low volatility and consolidation. This quiet environment is ideal for institutions to accumulate large positions without causing significant price shifts. This consolidation creates clear pools of buy-side liquidity (above the range high) and sell-side liquidity (below the range low). -
London Killzone (2 AM - 5 AM EST): The Manipulation Phase
The London open brings a surge of volatility. This is the prime window for institutions to stage the manipulation, often called the Judas Swing. They will drive price aggressively in one direction to sweep the liquidity built up during the Asian session, stop out early traders, and induce breakout traders to enter on the wrong side of the market. This move very often establishes the high or the low of the entire trading day. -
New York Killzone (7 AM - 10 AM EST): The Distribution Phase
Following the London manipulation, the "true" move of the day—the distribution phase—typically gets underway. This powerful, directional expansion often begins late in the London session and continues with momentum through the New York open. The NY Killzone may sometimes offer a secondary retracement for a high-probability entry before price continues its expansion toward the higher timeframe draw on liquidity.
Let's visualize this standard timeline.
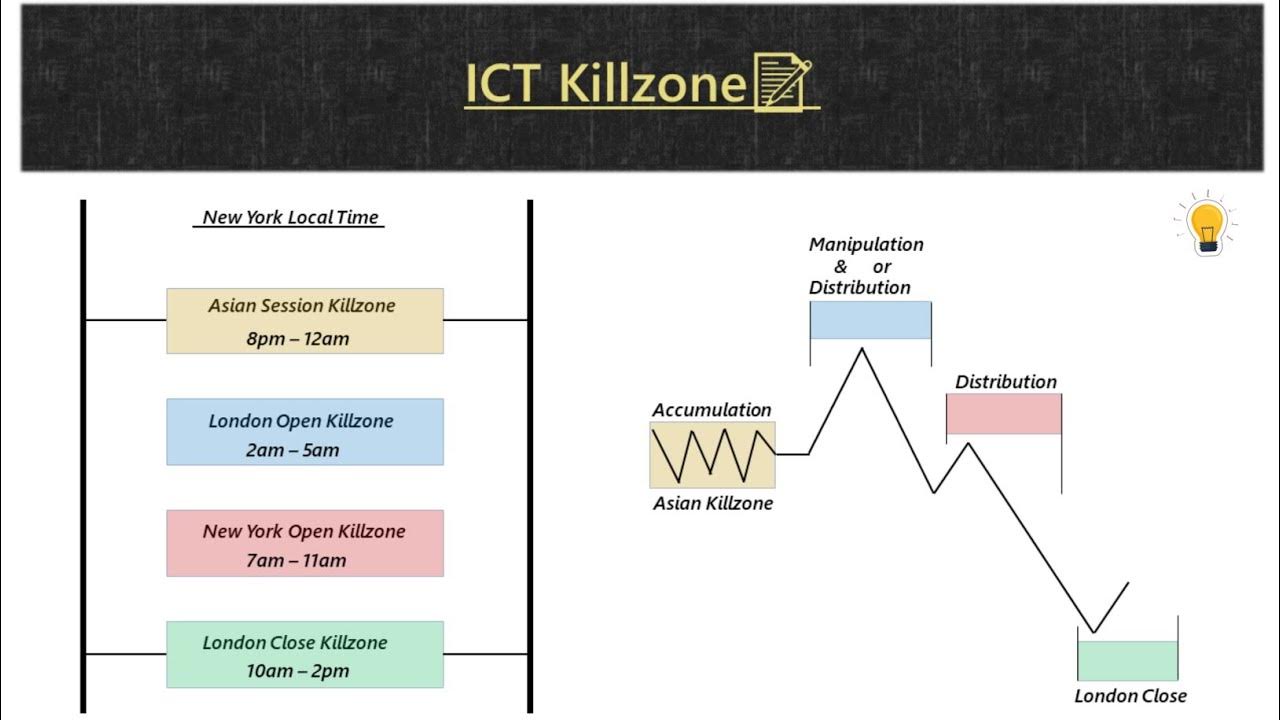
Of course, the market isn't always this neat. The image below shows a few different "daily narratives" to illustrate how the sessions can interact. The most common one for day traders to focus on is "Asia Range, London Manipulation, NY Reversal/Continuation."

3. The London Killzone: Prime Time for the Judas Swing
The most crucial part of this timeline to master is the link between the London Killzone and the Judas Swing (manipulation). This is the event that sets the stage for the rest of the day.
Let's look at a resource that specifically defines the timing of the Judas Swing.
ICT Judas Swing Strategy: Step-by-Step Guide
The article 'ICT Judas Swing Strategy' from TradingFinder provides precise timing for this key event, confirming its alignment with the London session.
First, read the section 'When Does the ICT Judas Swing Occur?'. Then, review the FAQs at the end of the article, specifically the questions titled: 'When does the ICT Judas Swing occur?' 'What is ICT London Judas Swing?' 'What is London Open Judas Swing?' 'What is Judas Swing Time for London Session?' These sections firmly establish the London Killzone as the primary window for the manipulative move.
By anticipating this manipulative move between 2 AM and 5 AM EST, you can avoid being trapped and instead prepare to position yourself for the true directional move that follows.
4. Seeing the Blueprint in Action
Theory is great, but seeing this cycle play out on a chart is essential. The following video demonstrates how the London session manipulates the Asian range before the distribution phase begins.
In this video from TTrades, 'ICT Power Of 3 - AMD', we'll see chart examples that bring this time-based concept to life.
Watch the segment from 06:28 to 09:27. The presenter walks through two clear examples. For each one, identify: The 'consolidation range' or 'accumulation' happening during the Asian session. The aggressive move during the London session that sweeps liquidity—this is the manipulation. The subsequent reversal and expansion—this is the distribution that carries into the New York session.
These examples clearly show the pattern: Asia builds the range, London fakes a move to take liquidity, and then the true trend for the day begins.
5. A Practical Tip: Work Backwards from Manipulation
Sometimes, the accumulation range isn't perfectly clean. A powerful technique is to wait for the aggressive manipulation during the London Killzone first and then work backward to identify the range it came from. Let's watch one final example that illustrates this practical approach.
Let's revisit the 'ICT Power Of 3 - AMD' video for a final, detailed walkthrough that shows a professional way to apply this concept in real-time.
Please watch the clip from 11:09 to 15:54. Notice how the presenter gives a tip: 'instead of focusing on the consolidation, just focus on where there is aggressive price action out and back into a range.' He spots the manipulation, identifies the range it came from, and then anticipates the distribution. This is a key insight into how to use this model practically.
By using the London Killzone as your timing filter to spot the manipulation, you can frame the entire AMD cycle with much greater clarity.
Conclusion
You have now integrated the "what" (Power of 3) with the "when" (Killzones), a major step in building a predictive framework for your trading.
Key Takeaways:
- Time & Price: The Power of 3 cycle is not random; it unfolds within specific time windows.
- The Daily Blueprint: A standard daily narrative is: Asia (Accumulation) -> London (Manipulation) -> New York (Distribution).
- The London Killzone is Key: This window (2 AM - 5 AM EST) is the prime time for the Judas Swing, which often sets the high or low of the day.
- Practical Application: You can wait for the manipulative spike during the London session to confirm your bias and frame the subsequent distribution phase.
Preview of the Next Lesson:
You now understand daily bias, the three phases of the Power of 3, and how they relate to the trading day's timeline. In our final lesson for this module, we will put it all together. You will learn how to "Combine daily bias with the Power of 3 to anticipate the daily price narrative," creating a complete and actionable hypothesis before the trading session even begins.