Hello! Welcome to the next lesson in our "Power of 3" module.
In our previous lessons, we identified the accumulation phase as a period of quiet consolidation and the manipulation phase (Judas Swing) as a deceptive move to trap traders and hunt liquidity. You now understand the setup and the trap. Today, we focus on the final and most important part of the sequence: the distribution phase.
This is the true directional move for the session—the powerful expansion where smart money realizes their profits. By the end of this lesson, you will be able to identify this phase, understand what triggers it, and see how it fits into the overall daily price narrative. Mastering this will be key to aligning your trades with the market's real intent.
1. What is the Distribution Phase?
After institutions have accumulated their positions and engineered liquidity through manipulation, the distribution phase begins. This is the "real move" of the day. It's characterized by a strong, directional price leg that is aligned with the higher timeframe bias.
This phase is where you, as a trader, want to be participating. Let's clarify its key characteristics.
Accumulation Distribution Guide: Trading the AMD & Power of 3
The following article, 'Accumulation Distribution Guide' from ThinkCapital, provides a concise and clear definition of the distribution phase. It highlights the key attributes you need to look for.
Please read the introductory section 'Understanding the AMD Phases' and then focus on subsection '3. The Distribution Phase'. Pay close attention to its characteristics: movement, momentum, and duration.
As you've just read, the distribution phase isn't subtle. It's a move with conviction, often featuring large, decisive candles and expanding volume as the true trend for the day becomes apparent.
2. Visualizing the Full AMD Cycle
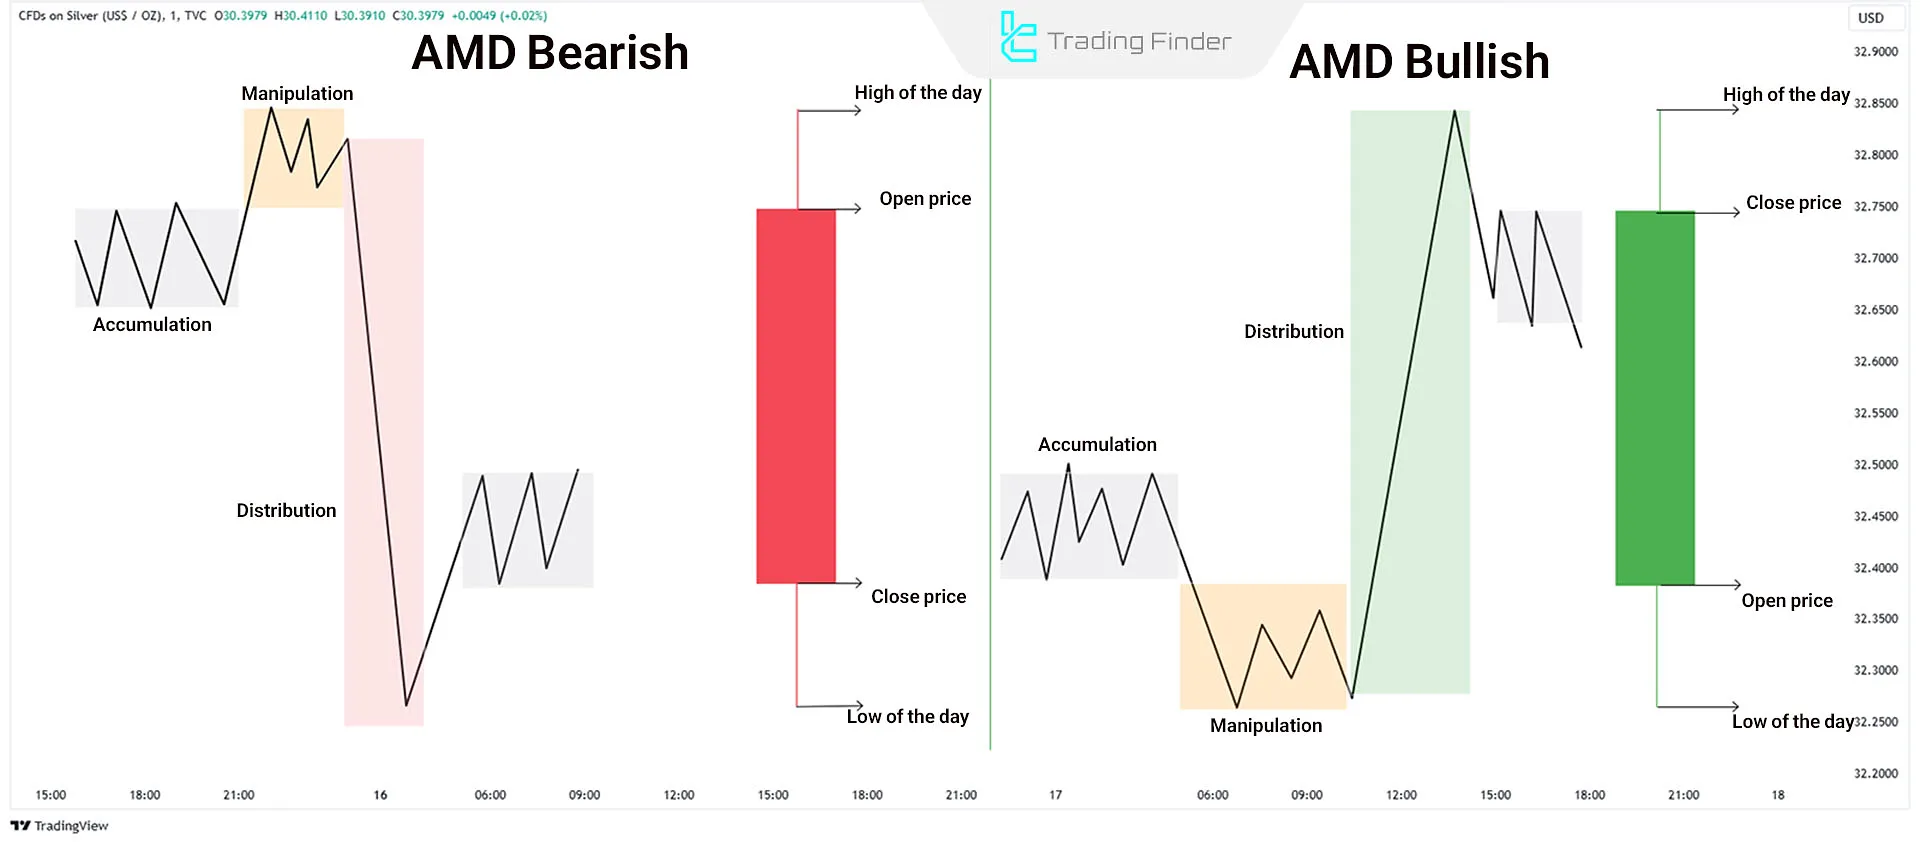
Now, let's put all three pieces together: Accumulation, Manipulation, and Distribution. The relationship between these intraday phases and the resulting daily candle is a cornerstone of the ICT methodology.
- Accumulation: Price consolidates, forming a range.
- Manipulation: Price sweeps one side of the range (the Judas Swing), creating the wick of the daily candle.
- Distribution: Price expands powerfully in the opposite direction, forming the body of the daily candle.
Let's see this on a real intraday chart.
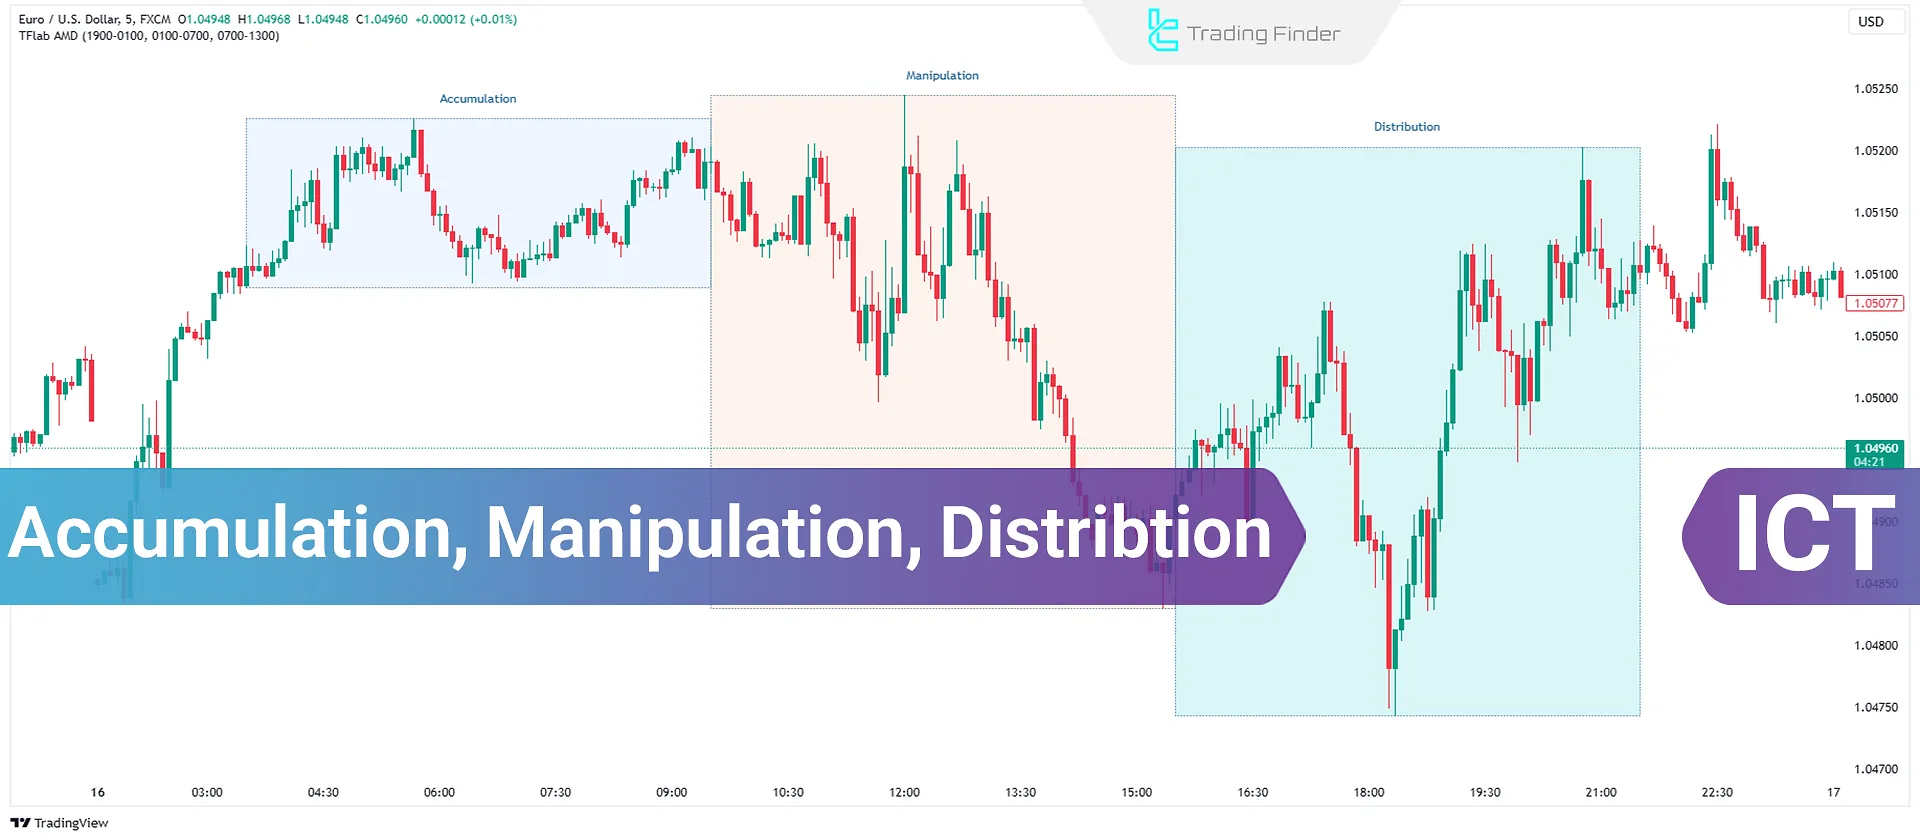
3. The Signal: Transitioning from Manipulation to Distribution
The most critical question is: how do we know the manipulation has ended and the distribution is beginning?
The answer lies in market structure. You've already learned about the Break of Structure (BOS) and Change of Character (CHoCH) in Module 2. This is where that knowledge becomes crucial. The transition from manipulation to distribution is typically confirmed by a sharp reversal that breaks the short-term market structure created during the manipulative leg.
Accumulation Distribution Guide: Trading the AMD & Power of 3
Let's revisit the 'Accumulation Distribution Guide' to see how a change in market structure signals the start of distribution.
Please find and read the sections titled 'Identifying the Transition: Order Blocks and Structure' and the FAQ 'What is a “Change in Character” (CHoCH) in AMD trading?'. These sections explain that a break of market structure is the first reliable signal that the distribution phase is underway.
4. Chart Examples in Motion
Seeing these phases unfold on a chart is the best way to internalize the concept. The following video provides several excellent examples on different timeframes, showing the full AMD cycle from start to finish.
This video from TTrades, titled 'ICT Power Of 3 - AMD', walks through multiple examples of the complete cycle, giving you a dynamic view of how to spot the distribution phase.
Please watch from 03:23 to 09:27. As you watch each example, focus on: Identifying the initial accumulation range. Noticing the manipulative sweep that breaks out of the range. Watching for the aggressive reversal and break of structure that signals the start of distribution. Observing the strong, sustained directional move that defines the distribution phase.
5. The "Why": Daily Bias and the Draw on Liquidity
Finally, remember that the direction of the distribution phase is not random. It is purposeful and driven by the higher timeframe daily bias. The entire AMD cycle is engineered to move price toward a higher timeframe draw on liquidity (e.g., an old high/low or a large Fair Value Gap).
- If the daily bias is bullish, you expect a manipulation down followed by a distribution up.
- If the daily bias is bearish, you expect a manipulation up followed by a distribution down.
ICT Power Of Three - Explained In-depth
This final video from DanDowdTrading does an excellent job of putting the Power of 3 into its strategic context. It shows how to use a higher timeframe bias to anticipate the direction of the daily distribution.
Watch the clip from 03:46 to 10:44. The presenter starts with a bearish bias based on the higher timeframe. Notice how he anticipates a manipulation above the midnight opening price before looking to sell into the bearish distribution phase. This connects the AMD cycle directly to a logical trade thesis.
This strategic layer is what separates mechanical pattern-trading from professional, context-driven analysis. The distribution isn't just a pattern; it's the logical conclusion of an institutionally-driven plan.
Conclusion
You have now analyzed all three components of the Power of 3. You've seen how smart money accumulates positions, engineers liquidity through manipulation, and finally delivers price during the distribution phase.
Key Takeaways:
- The distribution phase is the true, powerful directional move of the session, representing the body of the daily candle.
- It is characterized by strong momentum, conviction, and often increased volume.
- The transition from manipulation to distribution is typically signaled by a Change of Character (CHoCH) or Break of Structure (BOS).
- The direction of the distribution is not random; it is guided by the higher timeframe daily bias and the draw on liquidity.
Preview of the Next Lesson:
We have covered daily bias and the three phases of the Power of 3. In our final lesson of this module, we will synthesize these concepts. You will learn how to "Combine daily bias with the Power of 3 to anticipate the daily price narrative," allowing you to build a complete, actionable hypothesis for the trading day.