Hello! Welcome back.
In our last lesson, we mastered the practical skills of switching between and synchronizing multiple timeframes on your charting platform. We ended with a fascinating observation: a single candlestick wick on a daily chart contains a rich, detailed story of price action on the lower timeframes.
Today, we will explore this phenomenon in depth. This lesson moves from the "how" to the "what" and "why." Our goal is to explain how higher timeframe price structure is composed of smaller, lower timeframe structures. This concept, known as the market's fractal nature, is the theoretical bedrock of the entire ICT top-down analysis approach. Understanding this will transform how you see the charts, revealing a hidden order and logic behind price movements.
1. The Fractal Nature of Price Action
At its core, the idea is simple: market structure is fractal. This means that the patterns of price movement repeat themselves across all timeframes, from the monthly chart right down to the 1-minute chart. A swing pattern you see on the daily chart is made up of smaller swing patterns on the 1-hour chart, which in turn are made of even smaller patterns on the 5-minute chart.
Think of it like a coastline. From a satellite, you see its large, jagged shape. If you zoom into one small section, you see a similar jagged shape. If you were to stand on the beach and look at a single rock, you would again see a smaller, jagged outline. Price charts exhibit this same self-similar quality at different scales.
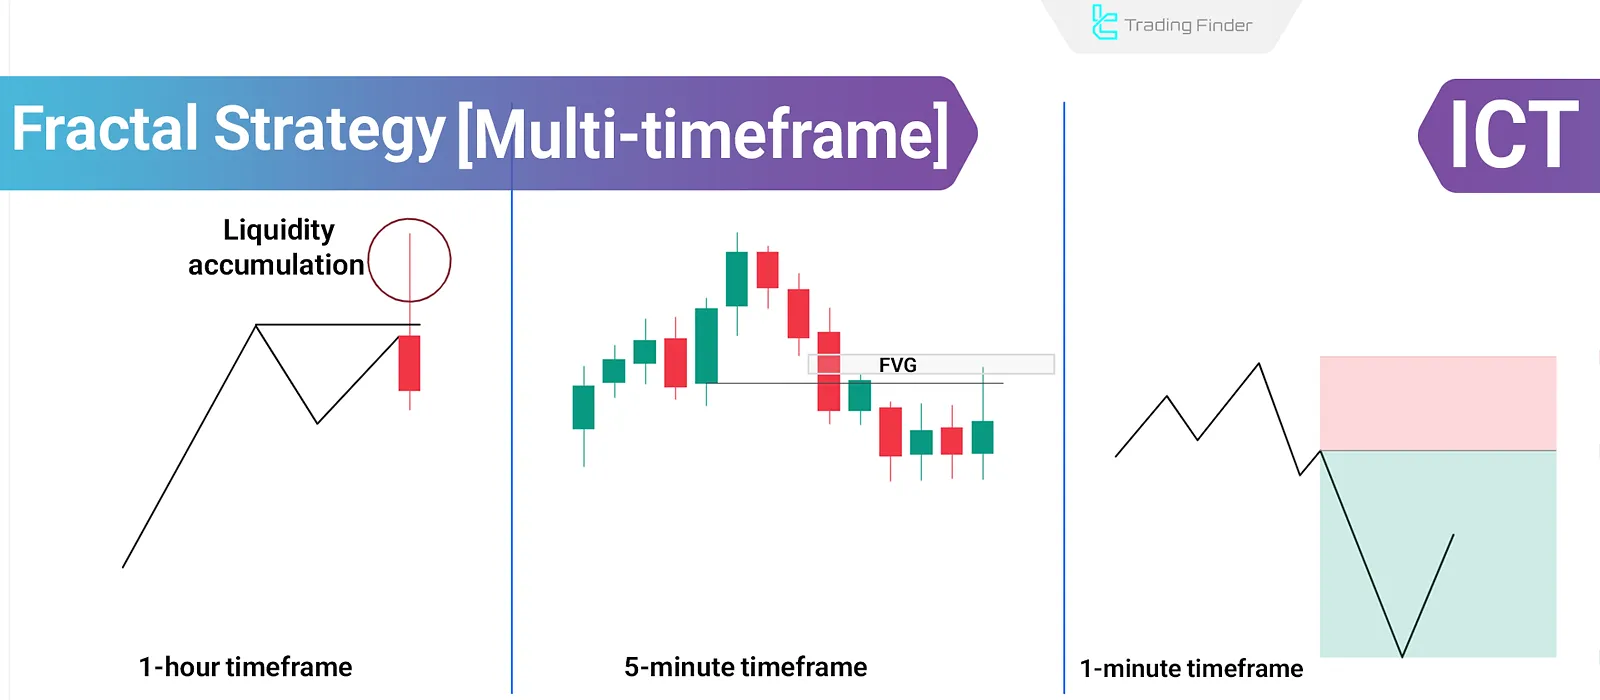
To solidify this definition, let's start with a short reading.
Fractal and Inversion Strategy in ICT
The article 'Fractal and Inversion Strategy in ICT' provides a very clear and direct definition of what we mean by 'fractal' in the context of trading.
Please read the two short paragraphs under the heading 'What Is the Fractal and Inversion Strategy in ICT Style?'. Then, jump to the 'FAQs' at the end and read the answer to the first question, 'What does the Fractal Model mean and why is it used in ICT?'. This will give you a concise summary of the concept.
2. The Building Blocks: Impulsive and Corrective Moves
So, how does this fractal structure actually form? Price doesn't move in a straight line. It moves in a series of waves. ICT categorizes these waves into two types:
- Impulsive Moves: Strong, energetic, and directional price movements that create significant displacement. These are the "drivers" of the trend.
- Corrective Moves: Weaker, shallower movements that go against the primary trend. These are periods of "relief" or consolidation before the next impulsive move.
The key to understanding the market's fractal nature is realizing that a large impulsive move on a higher timeframe is itself made up of smaller impulses and corrections on a lower timeframe.
The following video explains this relationship beautifully using the Elliott Wave Principle as a conceptual framework. You don't need to learn Elliott Wave theory, but it provides an excellent visual model for this idea.
How to Perform Multi-Timeframe Analysis - Smart Money Concepts
In this segment from 'How to Perform Multi-Timeframe Analysis' by Camelthorn FX, the presenter explains how trends are formed by impulses and corrections, and how these patterns are fractal.
Watch from 04:24 to 08:35. Pay close attention to how a large five-wave 'impulsive wave' contains smaller corrective waves within it. The analogy of impulses increasing price and corrections decreasing price in a bull market is a very helpful way to think about it.
3. External vs. Internal Structure
Now, let's connect these building blocks to our multi-timeframe analysis. This brings us to two crucial ICT terms:
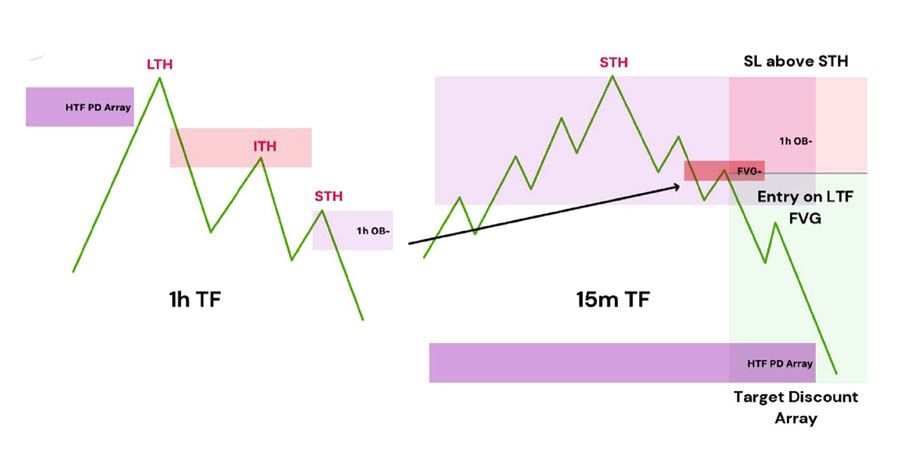
- External Structure: The major swing points (highs and lows) that define the main trend on your higher timeframe (HTF). This is the "big picture" price movement.
- Internal Structure: The smaller swing points that form within a single leg of the external structure. This detail is visible on your lower timeframe (LTF).
Essentially, a single impulsive leg of HTF external structure is the entire trend on the LTF, complete with its own internal impulses and corrections.
Let's return to the same video, which provides an excellent visual demonstration of this relationship.
How to Perform Multi-Timeframe Analysis - Smart Money Concepts
The next part of the Camelthorn FX video clarifies the relationship between external and internal structure using a simple color-coded analogy.
Watch from 12:32 to 15:00. Focus on the idea that the red line (representing the Daily chart) is the 'external structure', while the blue lines (representing the 4-Hour chart) show the 'internal structure' that creates the larger daily move.
This next image provides a concrete example on a real chart.
4. The Hierarchy of Timeframes: Why the HTF Rules
Since the higher timeframe structure is built from lower timeframe price action, it holds more weight. The HTF provides the overarching narrative and direction. Lower timeframe signals that contradict the higher timeframe bias are less likely to succeed.
This is a fundamental rule in ICT: always trade in the direction of the higher timeframe bias.
Best Timeframes: Step by Step Guide
In this clip from 'Best Timeframes: Step by Step Guide', presenter Arjo explains this concept as the 'relativity theory' of trading.
Watch from 09:25 to 10:34. The key insight here is that a higher timeframe point of interest (like a Daily Fair Value Gap) has a stronger 'magnetic pull' than a lower timeframe one. This is why price will often ignore a 15-minute setup to travel to a more significant Daily level.
This principle is why we perform top-down analysis. We start on the HTF to figure out where the market is likely going (the draw on liquidity), and only then do we drill down to the LTF to find a precise entry that aligns with that direction.
5. Practical Timeframe Combinations
To put this all into practice, traders group timeframes into a logical hierarchy for their analysis. The specific timeframes you choose will depend on your trading style.
These are generally categorized as:
- Higher Timeframe (HTF): For overall bias and direction.
- Intermediate Timeframe (ITF): For confirming market structure and managing the trade.
- Lower Timeframe (LTF): For finding the precise entry point.
The following resource outlines the standard timeframe combinations for different trading styles.
Choose Timeframe in ICT - Top-Down Market Analysis
The article 'Choose Timeframe in ICT' from TradingFinder provides a clear breakdown of how to pair timeframes for different trading styles.
Please read the section 'Optimal ICT Timeframe Selection' and then review the examples provided for 'Position Trading', 'Swing Trading', 'Day Trading', and 'Scalping'. You don't need to memorize every detail, but focus on understanding how the HTF, ITF, and LTF roles are applied consistently across different trading horizons.
Here is a summary table for quick reference:
| Trading Style | Higher Timeframe (HTF) - Bias | Intermediate Timeframe (ITF) - Structure | Lower Timeframe (LTF) - Entry |
|---|---|---|---|
| Position | Monthly (M) | Weekly (W) | Daily (D) |
| Swing | Daily (D) | 4-Hour (H4) | 1-Hour (H1) |
| Day Trading | 4-Hour (H4) or 1-Hour (H1) | 15-Minute (M15) | 5-Minute (M5) or 1-Minute (M1) |
| Scalping | 15-Minute (M15) | 5-Minute (M5) | 1-Minute (M1) |
As an aspiring trader, you'll likely focus on the Day Trading or Swing Trading combinations.
Conclusion
You have now grasped one of the most essential pillars of the ICT methodology. Seeing the market as a fractal allows you to navigate its complexity with a clear framework.
Key Takeaways:
- Market structure is fractal: patterns of price movement are self-similar and repeat across all timeframes.
- A single move on a higher timeframe (HTF) is made of many smaller moves on a lower timeframe (LTF). This is the relationship between external and internal structure.
- The HTF structure dictates the overall bias. Lower timeframe analysis must be done in the context of the higher timeframe narrative.
- Traders use a top-down approach (HTF → ITF → LTF) to align their trades with the dominant market flow, regardless of their trading style.
Preview of the Next Lesson:
We've established that market structure exists and is fractal. But what exactly is structure? In the first lesson of our next module, we will get very specific. You will learn to define bullish and bearish market structure using swing points. We'll move from concept to concrete rules, giving you the ability to objectively map out the market's framework on any chart.