Hello! Welcome to the final lesson in our first module on the foundations of price action.
In our last session, we explored the market's fascinating fractal nature, understanding how large-scale price movements on higher timeframes are built from smaller, self-similar patterns on lower timeframes. This established the "what" and "where" of our analysis.
Today, we introduce the third crucial dimension of ICT trading: time. While the forex market is open 24 hours a day, not all hours are created equal. The market's behavior changes dramatically depending on which global financial centers are active. This lesson focuses on a core component of ICT's "Time & Price" theory. Our learning outcome is to identify market sessions (Asian, London, and New York) on a chart. Mastering this will allow you to focus your attention on the specific windows when the most significant price moves are likely to occur.
1. Trading with Time: An Introduction to ICT Kill Zones
Instead of being glued to the charts all day, ICT methodology teaches traders to focus on specific, high-probability windows of time. These are called Kill Zones. It's important to understand that a Kill Zone is not a trade setup or an entry strategy. It is simply a designated period when institutional order flow and market volatility are expected to be at their highest.
Think of it as knowing the primetime hours for the market. Your job is to show up when the "smart money" is most active.
The ULTIMATE Guide To Session Killzones (FULL Masterclass) | ICT
To start, let's get a clear definition of what a Kill Zone is. This short clip from 'The ULTIMATE Guide To Session Killzones' by CallistoFX explains the concept perfectly.
Watch from 01:01 to 01:40. Focus on the key idea that Kill Zones are time-based filters, not trading strategies.
2. Setting Your Clock: The Importance of New York Time
Before we define the session times, we must address the single most important (and most common) point of confusion: all ICT timings are based on New York local time. This is currently Eastern Daylight Time (EDT, which is UTC-4) or Eastern Standard Time (EST, which is UTC-5) depending on the time of year.
Why? Because New York is the world's largest financial center, and many key economic data releases and institutional activities are benchmarked to this time zone. To avoid any confusion with daylight saving changes, the simplest rule is to set your charting platform's time zone to "New York".
This video from TTrades clearly explains why this is so important.
ICT Killzones & Indicator Settings
Let's watch a brief segment from 'ICT Killzones & Indicator Settings' that emphasizes the need to synchronize your charts to the correct time zone.
Watch from 00:46 to 01:25. The key takeaway is to set your chart's timezone setting to 'New York' to ensure all your timings align with the ICT framework.
3. The Major Market Sessions (Kill Zones)
The 24-hour trading day can be broken down into three primary sessions that are of interest to us. Each has its own distinct characteristics and timings.
For a quick overview, please review the table and the descriptions for each Kill Zone in the following article.
Master All 4 ICT Kill Zones Times – Ultimate Guide
The article 'Master All 4 ICT Kill Zones Times' provides a concise summary of the timings and characteristics for each session.
First, review the table under the heading 'What are ICT Kill Zones?'. Then, quickly read the descriptions and characteristics provided for the 'ICT Asian Kill Zone Time', 'ICT London Kill Zone Time', and 'ICT New York Kill Zone Time'. Don't worry about the 'London Close' for now, we'll focus on the main three.
Now, let's dive into the specifics of each session with more detail.
A. The Asian Kill Zone
- Time: 8:00 PM – 12:00 AM New York Time
- Characteristics: The Asian session is typically a period of consolidation. Volume is generally low for major pairs like EUR/USD or GBP/USD. Price tends to move sideways, creating a relatively tight trading range. The primary function of this session is to build liquidity—creating clear swing highs and swing lows that will often be targeted in the next session.
- Active Pairs: AUD, NZD, and JPY pairs can show more activity as this session overlaps with their local business hours.
B. The London Kill Zone
- Time: 2:00 AM – 5:00 AM New York Time
- Characteristics: This is where the action begins. The London session is known for high volume and volatility. It very often features a manipulation move, where price will run above the Asian session high or below the Asian session low to trigger stops and engineer liquidity. After this "stop hunt," price will often begin its true directional move for the day, known as the expansion phase. The high or low of the entire day is frequently set during the London Kill Zone.
- Active Pairs: EUR, GBP, and CHF pairs are particularly volatile.
C. The New York Kill Zone
- Time (Forex): 7:00 AM – 10:00 AM New York Time
- Time (Indices like S&P 500): 8:30 AM – 11:00 AM New York Time (Note the difference!)
- Characteristics: This session begins as London traders are heading to lunch and New York traders are starting their day. This overlap creates another spike in volatility. Price action in New York can either be a continuation of the move established in London (often after a slight pullback or retracement) or a full reversal if the London move was itself a larger-scale manipulation.
- Active Pairs: USD pairs are the primary focus.
This image provides a great conceptual overview of the Kill Zones and how they often relate to a typical daily price cycle.

4. Identifying Sessions on Your Chart
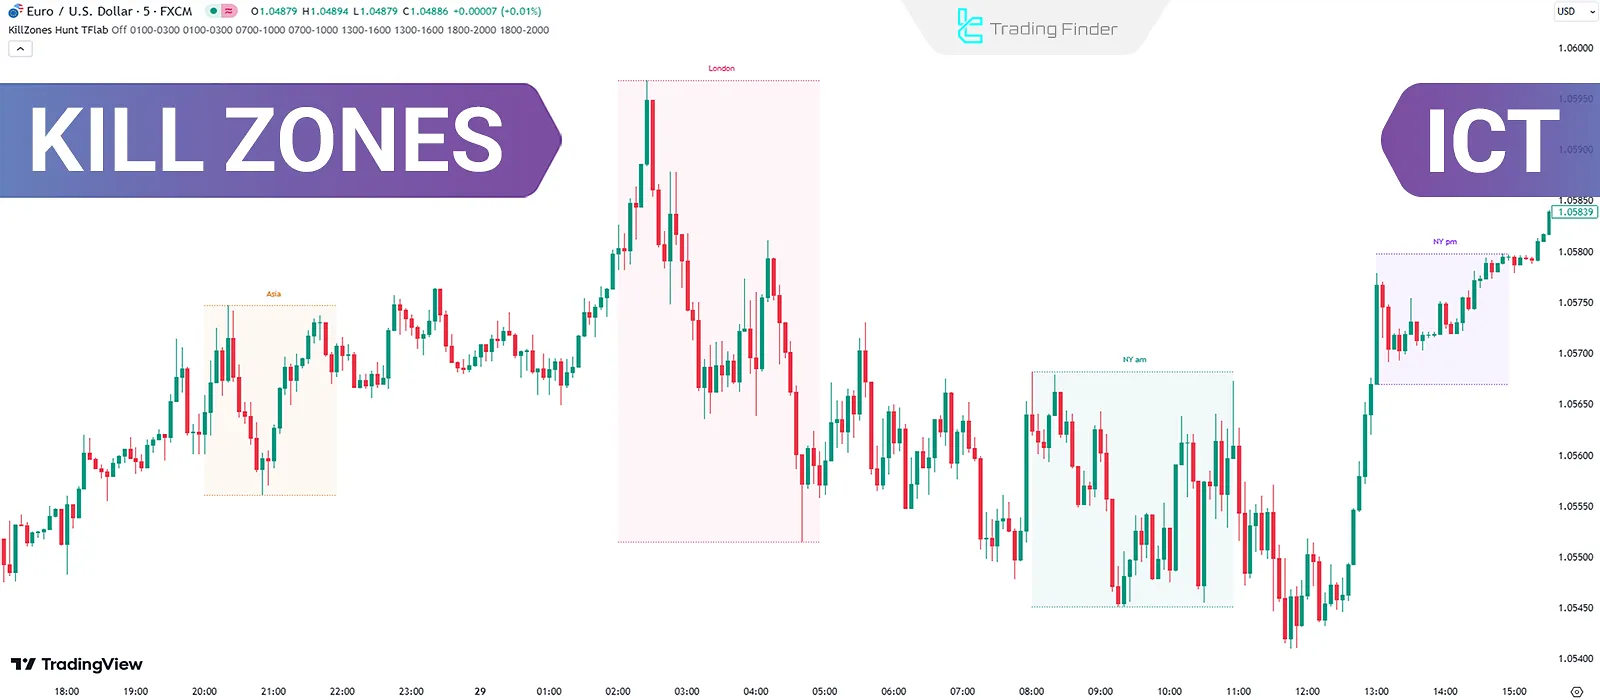
Knowing the theory is one thing; applying it is another. Your goal is to be able to look at a chart and immediately see these time-based segments. You can do this manually or with the help of an indicator.
Method 1: Manual Chart Markup
You can use the drawing tools in your platform (like TradingView) to draw vertical lines or colored boxes to delineate the sessions. This is an excellent exercise to help you internalize the timings.
Method 2: Using an Indicator
Many community-built indicators on platforms like TradingView can automatically draw the Kill Zones on your chart for you. This is a huge time-saver for daily analysis.
The following video demonstrates both methods clearly.
ICT Killzones & Indicator Settings
Let's return to the 'ICT Killzones & Indicator Settings' video. The presenter will now walk you through exactly how to mark the sessions on your chart, both manually and with a popular indicator.
Watch from 02:23 to 07:39. From 02:23 to 04:55, observe how he manually marks the Asian, London, and New York sessions for both forex and indices. From 04:55 to 07:39, pay attention to how he finds, adds, and customizes an indicator to automate this process. This is a very practical skill.
Here is an example of what your chart might look like with the sessions marked.
Conclusion
Congratulations on completing the first module! You now have a foundational understanding of price action, chart mechanics, the fractal nature of markets, and, as of today, the crucial element of time. By knowing when to look for trades, you can filter out noise and focus your energy on the highest-probability periods.
Key Takeaways:
- ICT trading is based on Time & Price; certain times of day (Kill Zones) offer higher volatility and clearer opportunities.
- All session timings must be viewed in the New York local time zone.
- Asian Session (8 PM - 12 AM NY Time): Tends to consolidate and build liquidity.
- London Session (2 AM - 5 AM NY Time): Often manipulates the Asian range and begins the day's primary expansion.
- New York Session (7 AM - 10 AM NY Time): Tends to continue or reverse the London move.
- You can and should mark these sessions on your charts, either manually or by using an indicator, to provide a clear temporal context for your analysis.
Preview of the Next Lesson:
This lesson concludes our module on foundational charting skills. We now move into Module 2: Market Structure Fundamentals. In our next lesson, we will build directly on what you've learned about swing points. Our goal will be to define bullish and bearish market structure using swing points. This will give us the objective, rules-based framework needed to determine the market's trend, which is the first step in formulating any trade idea.