Hello! Welcome back to our course on ICT trading.
In our last lesson, we focused on reading the story of individual candlesticks, learning how to interpret their bodies and wicks as signs of either powerful displacement or potential reversal. We ended with the idea that a single wick on a high timeframe chart can contain an entire price pattern on a lower timeframe.
Today, we'll build directly on that concept by mastering the practical tools needed for multi-timeframe analysis. This lesson is dedicated to a fundamental skill: demonstrating how to switch between and synchronize different timeframes on a charting platform.
While this may seem like a simple technical skill, it's the gateway to performing the sophisticated top-down analysis that is central to the ICT methodology. You'll learn not just how to change your chart's view, but how to set up a professional workspace that allows you to see the market's bigger picture and finer details simultaneously.
1. Efficiently Switching Timeframes
As a trader, you need to move between different views of the market fluidly. Jumping from a daily chart to a 5-minute chart should be effortless. Most traders using ICT methods use the TradingView platform, so our examples will focus on it.
There are two primary ways to change timeframes on TradingView:
- Toolbar Buttons: The most direct method. At the top of your chart, you'll find a toolbar with buttons for common intervals (e.g., 1m, 5m, 1H, 4H, 1D). You can click the arrow next to the current timeframe to see a full list and even "favorite" the ones you use most by clicking the star icon.
- Keyboard Shortcuts: The fastest method, which you'll come to prefer for its speed. Simply type the number of minutes and press Enter (e.g., type
15and Enter for the 15-minute chart). For other intervals, you add a letter:1H(or just60),4H(or240),1D,1W,1M.

The following guide provides a complete overview of these methods.
TradingView How to Change Timeframe: Complete Guide for Traders
The article 'TradingView How to Change Timeframe' from Pineify is a comprehensive guide on this topic. It covers all the essential methods you'll need.
Please read the sections 'Quick Method: Keyboard Shortcuts' and 'Mastering Chart Timeframes with TradingView's Buttons'. Focus on memorizing the keyboard shortcuts for minutes (number only), hours (number + 'H' or total minutes), and days (number + 'D').
2. The "Why": Adopting a Top-Down Perspective
Before we learn how to view multiple charts at once, it's crucial to understand why this is so important. ICT trading is built on top-down analysis. This means you start with a high timeframe (HTF) to determine the overall market direction or bias, then move to a middle timeframe (MTF) to identify key structure, and finally drop to a low timeframe (LTF) to find a precise entry.
This approach ensures you are trading in harmony with the dominant market flow, rather than getting caught in short-term noise.
To understand how ICT traders typically group these timeframes, the following video provides an excellent introduction.
Timeframe Alignment: How To Align Timeframes For Expansion
The video 'Timeframe Alignment' by TTrades explains the core concept of using a three-timeframe approach for analysis. It introduces the standard pairings that traders use.
Watch from the beginning to 02:59. Pay close attention to the three roles (Bias, Structure, Entry) and the specific timeframe pairings the presenter recommends, such as Daily -> 1-Hour -> 5-Minute.
As the video explains, aligning these timeframes is how you "stack the odds" in your favor. When the daily, hourly, and 5-minute charts are all pointing in the same direction, you have the conditions for a high-probability expansion move.
3. Setting Up a Synchronized Multi-Chart Workspace
Now, let's bring it all together. To perform top-down analysis efficiently, you need to see your different timeframes side-by-side. TradingView allows you to create layouts with multiple charts. More importantly, it allows you to synchronize them.
Key synchronization settings for ICT analysis include:
- Symbol: Ensures all charts are showing the same asset (e.g., EUR/USD).
- Crosshair: When you move your mouse over one chart, a crosshair appears at the exact same point in time on all other charts. This is essential for seeing how an HTF candle corresponds to LTF price action.
- Time & Date Range: When you pan or zoom on one chart, all other charts move in sync, keeping your analysis aligned.
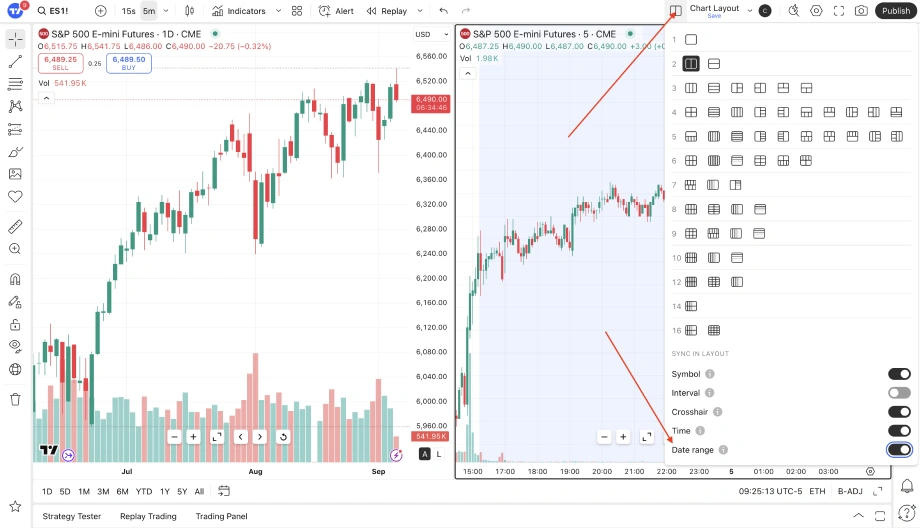
The following video is a practical, step-by-step guide to setting up and synchronizing your charts.
How to Sync Charts on TradingView
The video 'How to Sync Charts on TradingView' from Bullish Bears provides a clear, concise walkthrough of the entire process.
Watch from 01:05 to 03:42. Follow along on your own TradingView account if possible. Pay special attention to enabling sync for 'Symbol', 'Crosshair', and 'Date range', as these are the most critical for our purposes.
Note: Setting up multiple chart layouts requires a paid TradingView plan. However, understanding the process is vital, and you can still practice switching timeframes on a single chart with a free account.
4. Practical Application Exercise
It's time to put this into practice. This exercise will solidify your ability to set up a professional analysis workspace.
- Open a Multi-Chart Layout: On TradingView, click the "Select Layout" icon in the top-right toolbar and choose the layout with three charts.
- Set Up Your Timeframes:
- Set the largest chart to the Daily (1D) timeframe. This will be your "Bias" chart.
- Set one of the smaller charts to the 1-Hour (1H) timeframe. This is your "Structure" chart.
- Set the final chart to the 5-Minute (5m) timeframe. This is your "Entry" chart.
- Synchronize the Charts:
- Make sure all three charts are showing the same symbol (e.g., EUR/USD). If not, enable Symbol synchronization in the layout menu.
- Enable synchronization for Crosshair, Time, and Date Range.
- Explore the Fractal Nature:
- On your Daily chart, find a recent large candle with a prominent wick (like the reversal candles we studied in the last lesson).
- Place your crosshair directly on that wick.
- Now, look at your 1-Hour and 5-Minute charts. Observe the detailed price action that occurred during the formation of that single daily wick. You are now visually confirming the fractal nature of the market.
Conclusion
In this lesson, you've acquired a foundational technical skill that underpins all advanced ICT analysis. You are now equipped to navigate and organize your charts like a professional.
Key Takeaways:
- You can switch timeframes quickly using toolbar buttons or, more efficiently, with keyboard shortcuts.
- ICT analysis relies on a top-down approach, typically using three aligned timeframes for Bias, Structure, and Entry.
- A synchronized multi-chart layout (sharing Symbol, Crosshair, and Date Range) is the ideal workspace for this type of analysis.
Preview of the Next Lesson:
Now that you have the tools to view the market across different magnifications, we will delve deeper into the theory. In the next lesson, we will explain how higher timeframe price structure is composed of smaller, lower timeframe structures. You'll learn to see how a single swing high on the daily chart is formed by a complex sequence of smaller swings and structural breaks on the hourly chart, truly unlocking the market's fractal narrative.