Hello! Welcome back to our course on ICT trading.
In our last lesson, we learned to differentiate between powerful, impulsive price moves and weak, corrective ones. A key concept we introduced was displacement, the signature of an aggressive, institutionally-driven move that shows clear directional intent.
Today, we're zooming in from the price legs to the individual candlesticks that form them. This lesson is designed to help you achieve a crucial learning outcome: to interpret candle characteristics (wicks, bodies, and displacement) as used in ICT methodology.
We will move beyond the traditional candlestick patterns you may already know. In ICT, we don't just look for "hammers" or "dojis"; we read the story of order flow that each candle tells through its components. By the end of this lesson, you'll understand how to analyze a candle's body and wicks to gauge market momentum, identify potential reversals, and spot the footprints of institutional activity.
1. The ICT Perspective on Candlesticks
Before we dive into the details, it's important to understand a fundamental shift in perspective. In the ICT methodology, a candle's significance comes from three key aspects:
- Size: The range of the candle, particularly its body.
- Direction: Whether it's a bullish or bearish candle.
- Context: Its position relative to other candles and key price levels.
This approach views candles as a direct reflection of price delivery and order flow, rather than just geometric shapes. To get a primer on this mindset, the following reading is helpful.
The article 'ICT Candlestick Fundamentals' explains the core principles of how ICT views candlesticks. It will help shift your focus from pattern recognition to price action analysis.
Please read the first two main sections: 'Candlesticks’ Role In ICT Trading' and 'Understanding ICT Candlestick Basics'. Pay special attention to the idea of viewing a series of candles as a single higher timeframe candle.
2. The Candle Body: A Measure of Displacement
The body of a candlestick—the part between the open and close—tells you who won the battle for that session.
-
A large body signifies a decisive win. The larger the body and the closer the close is to the high (for a bullish candle) or low (for a bearish candle), the stronger the commitment from one side of the market. This is the visual signature of displacement. These candles forcefully "displace" price from one level to another.
-
A small body signifies indecision or equilibrium between buyers and sellers.

To reinforce your understanding of displacement, let's watch a short video that provides a clear, visual comparison between an energetic, displacing move and a weak one.
What is Displacement? - ICT Concepts
The video 'What is Displacement?' by TTrades offers a concise explanation of this crucial concept. It will help you visually identify the energy that characterizes an institutional move.
Watch from the beginning to 02:01. Focus on the visual difference the presenter highlights between a weak break of a high and an energetic, displacing break. Notice how the range and distance covered by the candles are key factors.
3. The Wicks: A Story of Liquidity and Rejection
The wicks (or shadows) of a candle show prices that were reached but ultimately rejected during the candle's period. From an ICT perspective, these wicks are not random noise; they are critical pieces of information.
Very often, a long wick represents a liquidity grab (also known as a "stop hunt"). This is where price is deliberately pushed above an old high or below an old low to trigger stop-loss orders and attract traders into entering in the wrong direction, before price aggressively reverses.
To understand how wicks are formed and what they represent, please read the following sections.
Candlestick wicks in ICT – identifying market reversals
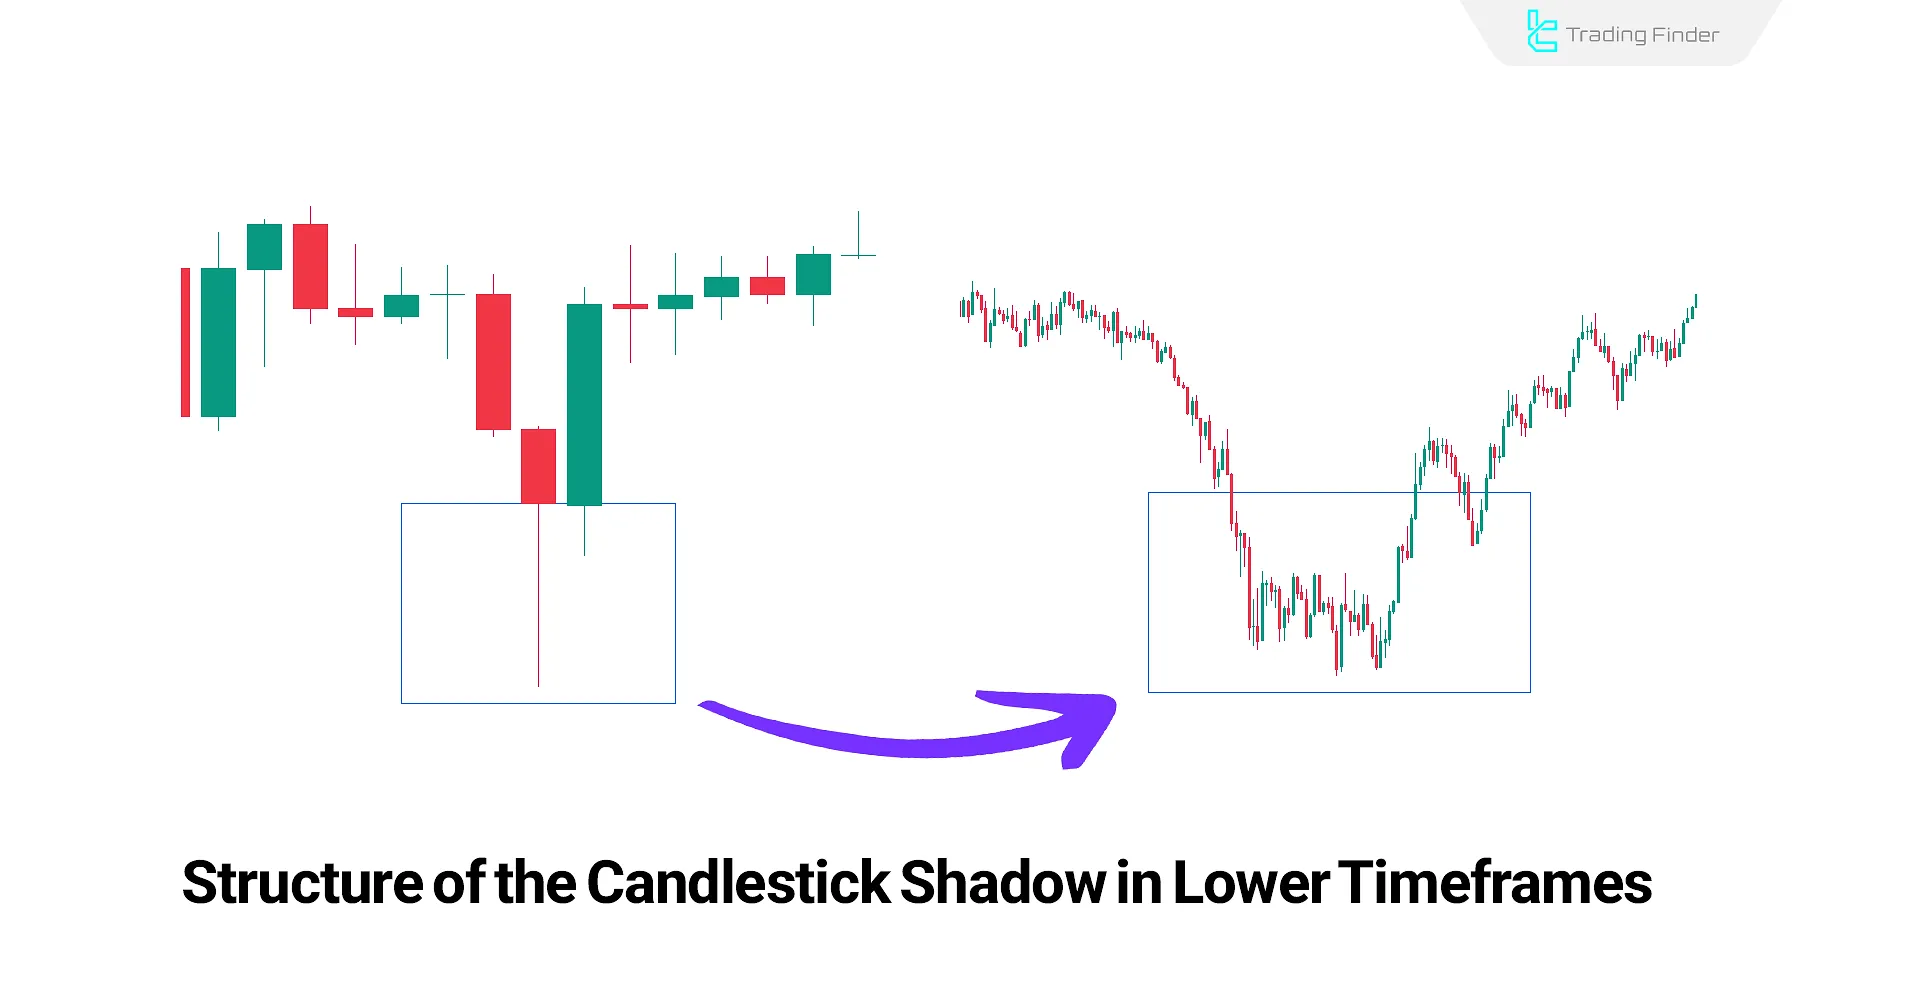
This article, 'Candlestick wicks in ICT', explains that wicks are not just rejection, but often a hunt for liquidity. It also shows how a wick on a higher timeframe is composed of an entire price pattern on a lower timeframe.
Read the sections 'What Is a Candlestick Wick?', 'How Wicks Are Formed?', and 'Analyzing Candlestick Wicks in ICT'. Pay close attention to the idea that long wicks are considered 'liquidity pools'.
As the article explained, a wick on your current chart represents a complete price narrative on a lower timeframe. The image below illustrates this perfectly.
A key concept for analyzing wicks is Consequent Encroachment (CE), which refers to the 50% midpoint of the wick. This level often acts as a sensitive point of support or resistance. Price reacting to this 50% level can give you clues about the strength of the rejection.
4. Expansion vs. Reversal Candles
Now, let's combine our understanding of bodies and wicks. This allows us to classify candles into two main functional types in the ICT framework:
- Expansion Candles: These have large bodies and small wicks. They are the engine of a trend, showing strong, sustained momentum in one direction. They are a clear sign of displacement.
- Reversal Candles: These typically have small bodies and long wicks. They show that price tried to move in one direction, was forcefully rejected (the long wick), and closed back near its open. These often mark turning points.
The following video is excellent for understanding this distinction. It introduces the idea of an "opposing run" during a candle's formation, which is what determines the size of the wick and the character of the candle.
Wick Size Matters: The Key to Understanding Reversal and Expansion Candles
The video 'Wick Size Matters' by TTrades provides a superb breakdown of expansion and reversal candles. It explains the mechanics behind their formation, which is key to interpreting them correctly.
Watch from the beginning until 06:08. Focus intently on the difference between a 'shallow opposing run' which creates an expansion candle, and a 'large opposing run' which creates a reversal candle.
Practical Application Exercise
Let's put this knowledge to work.
- Open your charting platform to any major currency pair (like GBP/USD or EUR/USD) on a 1-hour timeframe.
- Find a recent, significant price swing (a strong move up or down).
- Identify the Expansion Candles: Look within the core of the move. Can you spot the large-bodied candles with small wicks that drove the price? These are your expansion candles.
- Identify the Reversal Candle: Look at the very top of an up-swing or the very bottom of a down-swing. Do you see a candle with a long wick pointing in the direction of the peak/trough and a small body? This is likely your reversal candle that signaled the turn.
- Observe Context: After you spot a reversal candle, what kind of candles follow it? Do you see expansion candles forming in the new direction?
This exercise will train your eyes to see beyond simple patterns and start reading the narrative of expansion and reversal that the market is constantly writing.
Conclusion
In this lesson, we dissected the candlestick to understand its meaning within the ICT framework. You've learned to read the story of institutional order flow told by a candle's body, its wicks, and the energy of its formation.
Key Takeaways:
- Candle bodies represent commitment. Large bodies signify displacement and institutional force.
- Candle wicks represent rejection and often indicate a hunt for liquidity. The 50% level of a wick (Consequent Encroachment) is a key reference point.
- Expansion Candles (large body, small wicks) drive trends forward with momentum.
- Reversal Candles (small body, long wicks) often signal the end of a move and a potential change in direction.
Preview of the Next Lesson:
We have now examined swing points, the nature of price legs, and the characteristics of individual candles. In our next lesson, we will explore how to switch between and synchronize different timeframes. You'll learn how a single expansion candle on the daily chart is actually a full trend on the 1-hour chart, and how a wick on the 1-hour chart can be a detailed entry pattern on the 1-minute chart. This concept of the market's fractal nature is the key to multi-timeframe analysis.