Hello! Welcome to the first lesson of our new module on developing a daily bias.
In our previous module, we focused on the element of time. You learned to identify the specific killzone windows where institutional activity is highest and how to use this timing as a powerful filter for your trade setups. We answered the crucial question of when to trade.
Now, we shift our focus to the question of where price is likely to go on any given day. This lesson tackles the first and most critical step in building a directional bias. We will work towards the learning outcome: Synthesize market structure and liquidity analysis to determine the weekly/daily draw on liquidity.
By the end of this lesson, you will be able to look at a higher timeframe chart and identify the specific price level that the market is most likely targeting—the "Draw on Liquidity." This concept is the magnetic north of your trading compass; it provides the destination for the daily price narrative.
1. The "Why" Behind Price Movement
Before we can predict where price is going, we must understand why it moves at all. In the ICT framework, price is not random. It is algorithmically delivered and moves for two primary reasons:
- To rebalance inefficiencies: This involves filling in gaps in price delivery, like the Fair Value Gaps (FVGs) we've studied.
- To seek liquidity: This means targeting areas where a large number of orders are resting, such as above old highs or below old lows.
The Draw on Liquidity (DOL) is simply the next specific pool of liquidity that the market algorithm is reaching for. Identifying this "draw" gives you a high-probability target for the day or week.
Let's begin with a short reading that clearly defines the role of liquidity as a primary driver of price.
ICT Daily Bias Explained in Depth
The article 'ICT Daily Bias Explained in Depth' from innercircletrader.net succinctly explains the two main reasons for price movement. Understanding this is key to grasping the concept of a 'draw'.
Please read the section 'How to Identify ICT Daily Bias?'. Focus on points (II) 'Any Imbalance to rebalance' and (III) 'Draw on Liquidity'. This will frame our entire discussion.
2. The Two Major Types of Liquidity Draws
The market is constantly moving between two types of liquidity:
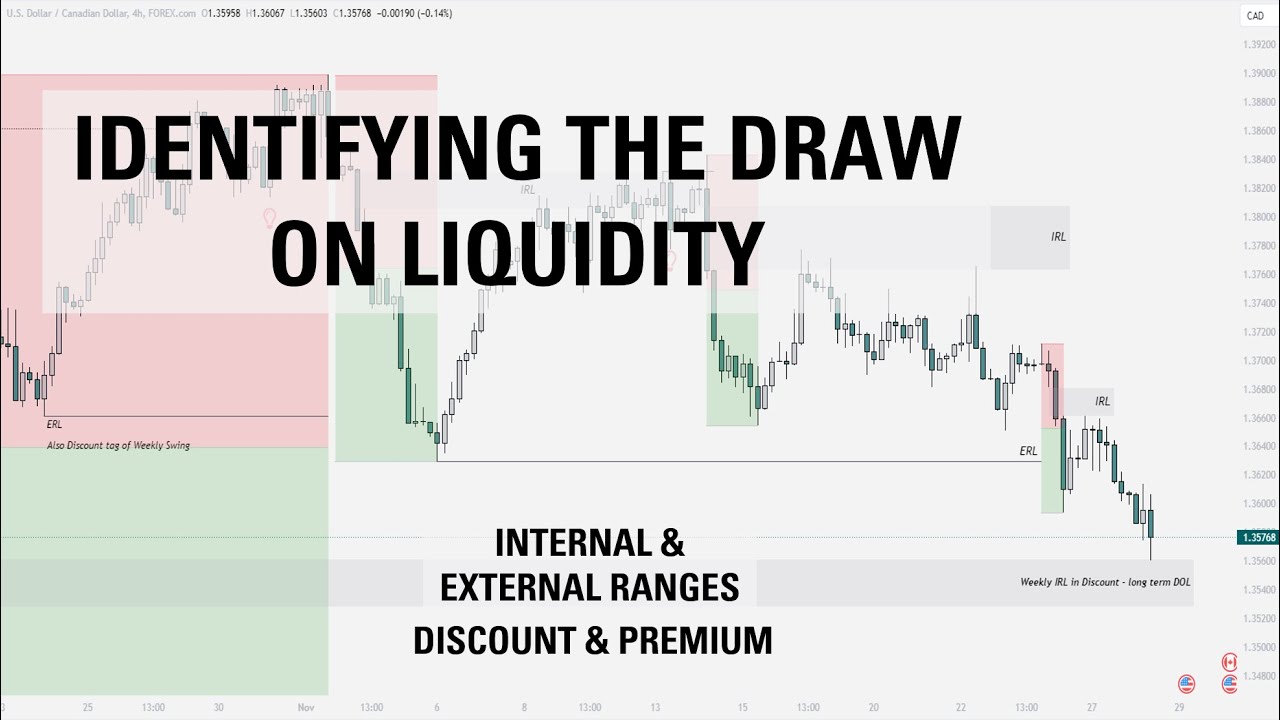
- External Range Liquidity: This refers to liquidity resting outside of a recent trading range. Think of old swing highs and lows on the daily or weekly chart, or the previous day's high/low. This is where stop-loss orders from long-term participants accumulate.
- Internal Range Liquidity: This refers to inefficiencies inside a recent trading range. Prime examples are Fair Value Gaps (FVGs) and unmitigated Order Blocks.
Price will often sweep external liquidity and then retrace to target internal liquidity, or vice-versa. Understanding which type the market is currently seeking is a core skill.

To further clarify these concepts, let's review a clear written definition of the liquidity pools that act as a draw.
Draw on Liquidity (DOL) in ICT; [BSL + SSL] Liquidity Levels
The article 'Draw on Liquidity (DOL) in ICT' from TradingFinder provides clear, concise definitions of the types of liquidity that serve as market targets.
Read the sections 'How to find draw on liquidity? Types of Liquidity in the Market' and 'Identifying Draw On Liquidity Movement'. Focus on the definitions of Buy-Side Liquidity (BSL), Sell-Side Liquidity (SSL), and the list of common targets.
3. A Simple Starting Point: The Previous Day's High and Low
While there are many potential liquidity targets, the most consistent and reliable for framing a daily bias are the Previous Day’s High (PDH) and the Previous Day’s Low (PDL).
The logic is straightforward and ties directly into the market structure concepts you learned in Module 2:
- In a bullish trend (a series of higher highs and higher lows), the market is more likely to take out the PDH.
- In a bearish trend (a series of lower lows and lower highs), the market is more likely to take out the PDL.
Let's watch a video that demonstrates this simple yet powerful idea.
The Easiest Draw On Liquidity (DOL) - Daily Bias - ICT
The video 'The Easiest Draw On Liquidity (DOL)' by TTrades provides a fantastic, practical introduction to using the previous day's high and low as your primary target.
Watch from the beginning to 04:27. Note how the presenter connects the concept of 'trend' directly to which side of the previous day's range is likely to be targeted. Also, pay attention to his use of 'displacement'—a strong, energetic price move—as confirmation that a liquidity level has been taken and price is heading in a new direction.
This gives us our first building block: observing the daily chart's market structure gives us a strong clue about whether the PDH or PDL is the next logical draw on liquidity.
4. Synthesizing the Clues: A Top-Down Approach
Identifying the draw on liquidity is a process of synthesis. It involves looking at the market from a high-level perspective (weekly, daily charts) and then zeroing in on the most probable target for the current session. This is known as top-down analysis.
You are essentially a detective, gathering clues from different timeframes to build a compelling case for where price is headed. A liquidity target on the weekly chart is far more significant than one on the 15-minute chart.
This video provides an excellent walkthrough of this analytical process.
Draw on Liquidity (DOL) - ICT Concepts
Let's see this top-down analysis in action. In 'Draw on Liquidity (DOL) - ICT Concepts', TTrades demonstrates how to read the story of the market by starting with a higher timeframe bias.
Please watch from the start until 07:24. Observe how the analysis begins by identifying a major target on the 4-hour or Daily chart (like an old high or a large FVG). This higher timeframe narrative then dictates the expected draw for the current day's trading session.
To formalize this process, here is a step-by-step checklist you can use every day:
- Start on the Weekly and Daily Charts: Identify the major external liquidity pools. Mark out the previous week's high and low, and any obvious, untouched swing highs or lows. These are the long-term magnets for price.
- Analyze Daily/4-Hour Market Structure: Is the order flow bullish (breaking structure to the upside) or bearish (breaking structure to the downside)? This provides the immediate directional context.
- Identify Key Internal Liquidity: Look for significant, nearby Fair Value Gaps or unmitigated Order Blocks on the Daily or 4-Hour chart. Price may need to pull back to these levels before continuing toward the main external target.
- Form a Hypothesis: Combine these elements. For example: "The weekly structure is bullish. Price recently swept a daily low and broke structure higher. The most logical draw on liquidity is now the old weekly high above us. Therefore, my primary DOL is bullish."
This process transforms you from a pattern-spotter into a market narrator, building a logical story for price movement.
Conclusion
In this lesson, you've learned to identify the market's destination. By synthesizing market structure with an analysis of internal and external liquidity, you can now perform a top-down analysis to determine the most probable weekly and daily draw on liquidity. This is the foundational skill upon which all short-term trading decisions are built.
Key Takeaways:
- The Draw on Liquidity (DOL) is the specific target—either an inefficiency or a liquidity pool—that the market algorithm is currently seeking.
- Liquidity targets are categorized as External (old highs/lows) and Internal (FVGs, Order Blocks).
- The simplest and often most reliable daily DOL is the Previous Day's High (PDH) or Previous Day's Low (PDL), depending on the market trend.
- Determining the DOL is a top-down process that requires synthesizing clues from the weekly, daily, and 4-hour charts to build a directional narrative.
Preview of the Next Lesson:
Now that you can identify the destination (the DOL), the next step is to plan the journey. In our next lesson, "Formulate a directional hypothesis (daily bias) for the upcoming session," we will use the DOL you've identified to create a concrete, actionable trading plan for the day, anticipating the likely path price will take to reach its target.