Hello! Welcome to the second lesson in our module on Daily Bias.
In our last session, we established the "destination" by learning how to identify the Draw on Liquidity (DOL). You learned to perform a top-down analysis to find the most probable high-impact liquidity pool or imbalance the market is targeting on a weekly or daily basis.
Today, we build directly on that foundation. Knowing the destination is one thing; planning the daily route is another. This lesson is about forming a daily bias—a directional hypothesis for the upcoming trading session. We will address the learning outcome: Formulate a directional hypothesis (daily bias) for the upcoming session.
By the end of this lesson, you'll be able to synthesize higher timeframe context with specific daily price action clues to decide whether you should be looking for buying or selling opportunities for the day. This is the compass that keeps your trading aligned with the dominant market flow.
1. What is Daily Bias and Why Does It Matter?
Before we dive into the "how," let's solidify the "what" and "why." The daily bias isn't just a guess; it's a structured, evidence-based hypothesis about the most probable direction of price for the day. It provides the strategic context for all your intraday trading decisions.
What is the Daily Bias? Identifying Market Direction in the ICT Method
To start, let's get a clear definition and understand the critical role daily bias plays in an ICT-based strategy. This article from TradingFinder lays it out well.
Please read the sections 'What is the Daily Bias?' and 'Why is the daily directional bias important in the ICT style?'. Focus on how bias acts as a filter, aligning your analysis with the flow of smart money.
As the article explains, having a daily bias prevents you from getting caught on the wrong side of the market. It filters out low-probability setups and focuses your attention on trades that are in harmony with the market's larger objective.
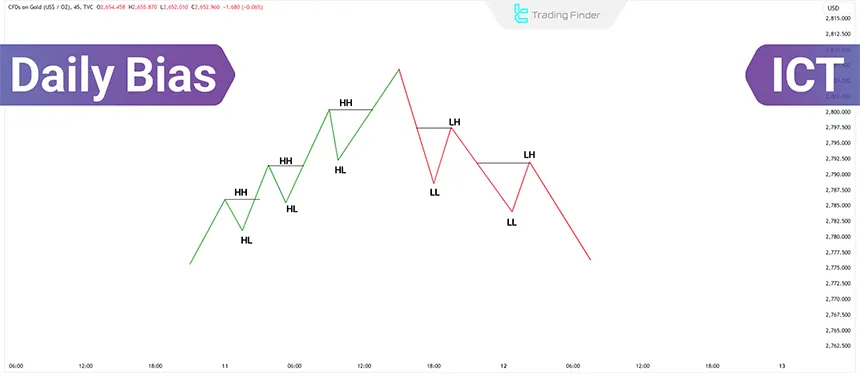
2. A Core Framework: The Flow Between Liquidity Types
In the last lesson, you learned about two types of liquidity: External Range Liquidity (old highs/lows) and Internal Range Liquidity (imbalances like Fair Value Gaps). The movement of price between these two types forms the backbone of directional bias.
The market algorithm has a simple, repeatable logic:
- After taking external liquidity (e.g., sweeping a major swing low), price will seek to rebalance at internal liquidity (e.g., an FVG in a discount).
- After rebalancing at internal liquidity, price will then target the next pool of external liquidity (e.g., a major swing high).
This perpetual dance between external and internal liquidity provides a powerful model for anticipating the market's next move.
Internal & External Liquidity (Daily Bias) - ICT Concepts
The video 'Internal & External Liquidity' from TTrades explains this fundamental market rhythm. Understanding this model will give you a robust framework for determining your bias.
Watch from the beginning up to 04:07. Pay close attention to the core principle explained in the first minute: price moves from external to internal, and back to external. The weekly chart example then shows how this creates a directional bias that can last for an entire week.
This model provides your high-level, structural bias. If price has just taken out a major weekly high (external liquidity), your bias will likely be bearish as you anticipate a move down to rebalance a daily Fair Value Gap (internal liquidity).
3. Tactical Clues: The "Next Day Model"
While the external-to-internal model gives us a strategic, long-term bias, we also need tactical clues to confirm our hypothesis for the next trading day. One of the most effective techniques for this is observing how price behaves around the previous day's high and low (PDH/PDL) and other key swing points.
This leads to a concept often called the "Next Day Model," which is based on a simple but powerful observation of "failure to displace."
- Bearish Signal: If price moves above a key swing high (like the PDH) but fails to close above it, instead closing back within the previous range, it's a sign of weakness. This "liquidity sweep" or "stop hunt" suggests that the next day's bias is likely bearish.
- Bullish Signal: Conversely, if price moves below a key swing low (like the PDL) but fails to close below it, closing back within the range, it's a sign of strength. This suggests the next day's bias is likely bullish.
Let's see this in action.
ICT Daily Bias - The Only Video You Will Ever Need!
The following video, 'ICT Daily Bias - The Only Video You Will Ever Need!', provides excellent examples of how to read these daily clues to formulate your bias.
First, watch the segment from 00:28 to 04:56, which focuses on using the Previous Day's High and Low. Notice how a close back inside the range after taking a high or low flips the bias. Then, watch the segment from 07:09 to 09:14, which formally introduces the 'failure to displace' concept and the 'Next Day Model' at swing points.
4. Synthesis and Avoiding Common Pitfalls
Formulating your daily bias is a process of synthesis. You combine the high-level structural bias (from the external-to-internal model) with the tactical clues from the previous day's price action.
Example Synthesis:
- HTF Structural Bias: The weekly chart shows price has taken out an old high (external liquidity) and is now trading down towards a daily FVG (internal liquidity). The overall bias is bearish.
- Daily Tactical Clue: Yesterday, price rallied up, took out the previous day's high, but then sold off aggressively and closed back inside the range.
- Conclusion: The tactical clue confirms the structural bias. My daily bias for today is strongly bearish. I will only be looking for shorting opportunities.
It's crucial to understand that the daily bias is derived from higher timeframes (Daily, 4H, 1H). A common and costly mistake is to form a bias based on short-term movements on the 5-minute or 1-minute chart. These lower timeframes are for trade execution, not bias formation.
What is the Daily Bias? Identifying Market Direction in the ICT Method
To wrap up, let's review some common mistakes traders make when determining bias. Acknowledging these pitfalls now will save you a lot of confusion and capital later. This section from the TradingFinder article is essential reading.
Please read the section 'Common Mistakes in Using the Daily Bias' and carefully study the 'Comparison Table of structural bias vs. momentary bias'. This table brilliantly distinguishes between the stable, high-timeframe bias you should follow and the noisy, temporary moves on lower timeframes.
Conclusion
You now have a structured process for developing a daily directional hypothesis. You've moved beyond simply identifying the destination (the DOL) to plotting the likely direction of today's journey (the Daily Bias). This skill is what separates proactive, prepared traders from those who react to market noise.
Key Takeaways:
- Daily Bias is a directional hypothesis for the day, used to filter trades and align with institutional order flow.
- It is always determined using a top-down approach, starting with higher timeframes.
- The External-to-Internal Liquidity model provides the high-level structural bias.
- The "Next Day Model," based on how price closes relative to key highs and lows, provides tactical confirmation for the upcoming session.
- Your structural bias must come from the Daily/4H charts. Lower timeframes are for entry confirmation only.
Preview of the Next Lesson:
We've established the destination (DOL) and the direction (Daily Bias). The next piece of the puzzle is understanding the narrative structure of the daily move. In the next lesson, we will introduce the "Power of 3" concept: Accumulation, Manipulation, and Distribution. This will show you how the daily range typically forms, helping you to better time your entries within your established bias.