Hello! Welcome to the third lesson in our module on The Power of 3 and Daily Bias.
In our previous lessons, we learned how to set a destination for price with the Draw on Liquidity (DOL) and how to determine the likely direction of travel with the Daily Bias. You now have a framework for knowing where price is likely going and in which direction.
Today, we'll explore the narrative of how price gets there. This lesson introduces the Power of 3 (PO3) concept, which models the typical sequence of events within a daily or session-based price cycle. By the end of this lesson, you will be able to explain the Power of 3 concept: Accumulation, Manipulation, and Distribution.
Understanding this blueprint will help you anticipate the day's price action, improve your timing, and avoid being trapped by false moves engineered by institutional players.
1. The Power of 3: An Overview
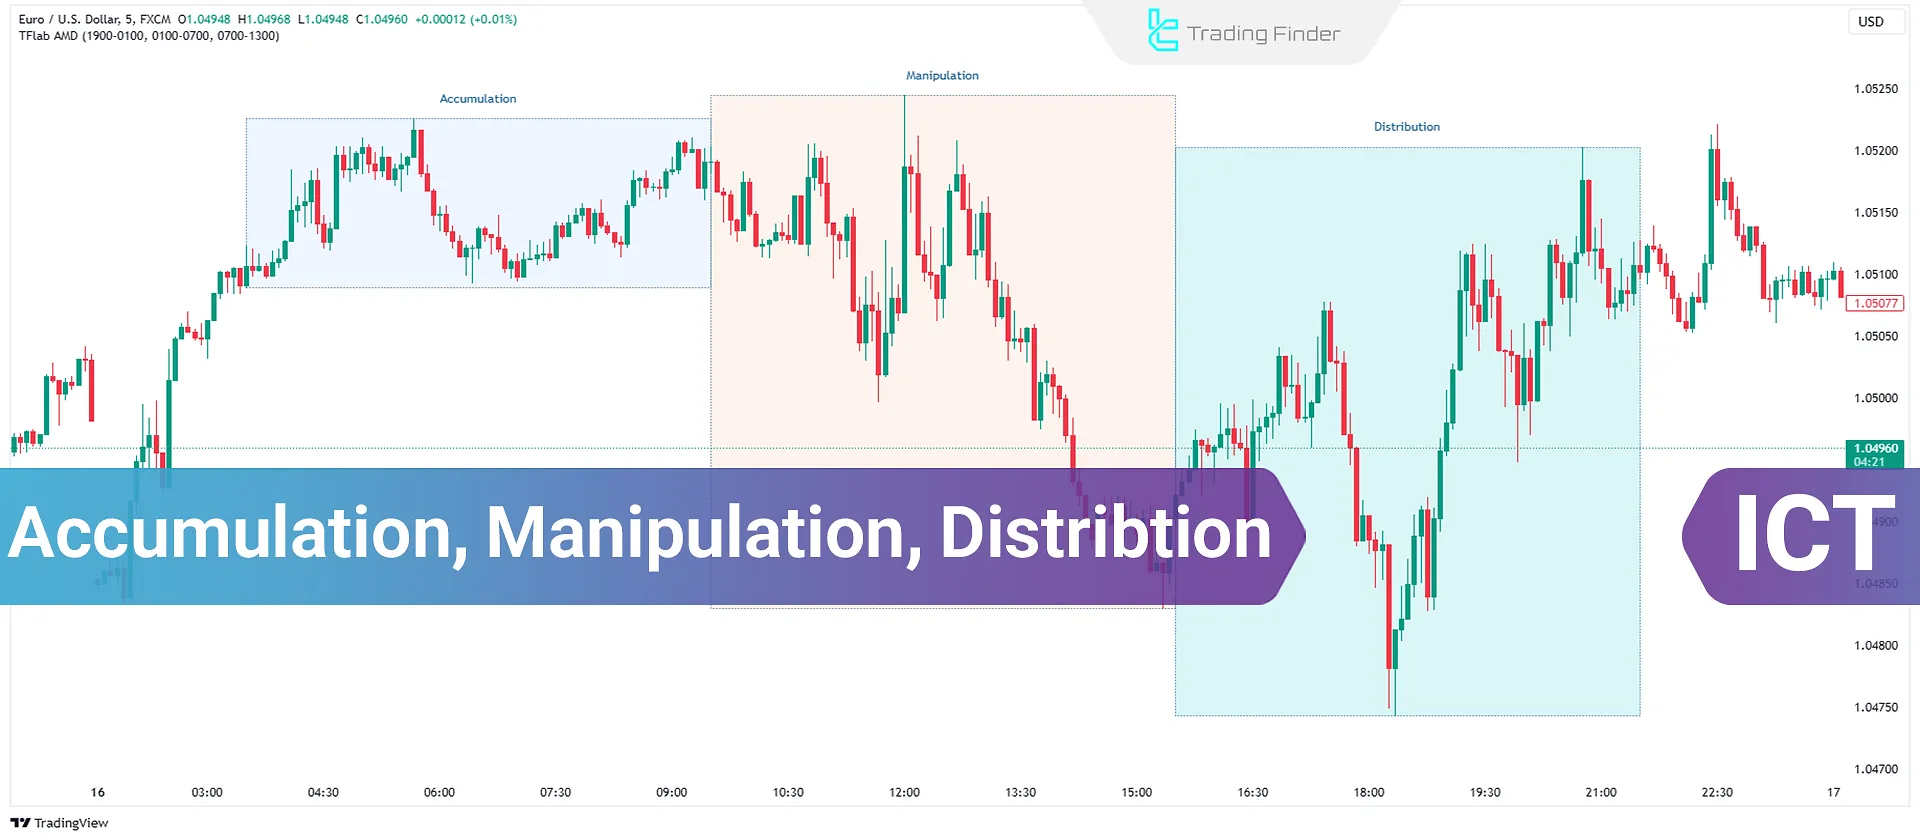
The Power of 3, often abbreviated as AMD, stands for Accumulation, Manipulation, and Distribution. It's a conceptual model that describes how "smart money" or institutional operators engineer price movements to build and offload their large positions.
Price is almost always in one of these three phases:
- Accumulation: A period of consolidation where smart money builds their positions and liquidity is created.
- Manipulation: A deceptive move against the true intended direction, designed to trap traders and hunt stop losses. This is also known as the "Judas Swing."
- Distribution: The true, impulsive move of the session where smart money distributes their positions for profit.
The image below provides a simplified visual of both a bullish (buy) and bearish (sell) Power of 3 cycle.

2. Deconstructing the Three Phases
To use this model effectively, you need a clear understanding of each phase's purpose and characteristics.
The Most Complete Guide on the ICT Power of 3
Let's establish a clear definition for each phase. The following article from TradingRage breaks down Accumulation, Manipulation, and Distribution with clear explanations and annotated charts.
Please read the sections titled 'Accumulation', 'Manipulation', and 'Distribution'. As you read, focus on the stated purpose of each phase from the perspective of an institutional trader.
To summarize and reinforce what you've just read, here are the core characteristics of each phase:
| Phase | Definition | Key Characteristics |
|---|---|---|
| Accumulation | Price consolidates in a range as smart money builds positions. | • Sideways, range-bound price action. • Low volatility. • Builds buy-side and sell-side liquidity. |
| Manipulation | A false move, typically against the daily bias, to engineer liquidity. | • A sharp move above/below the accumulation range. • Sweeps liquidity (stop hunt). • Traps breakout traders on the wrong side. |
| Distribution | The primary, directional price move for the session. | • An impulsive, high-momentum move. • Follows the direction of the daily bias. • Presents high-probability trade setups. |
3. The Logic: Why Does This Cycle Occur?
The Power of 3 isn't a random pattern; it's a logical consequence of how large institutions must operate in the market. To fill massive orders, they need a large pool of counterparty liquidity. The AMD cycle is how they systematically create and then consume that liquidity. The manipulation phase functions much like a deceptive marketing campaign, creating a false narrative to induce a specific action from retail traders, providing the liquidity institutions need.
Power Of 3 Simplified - 2023 ICT Concepts
This video from Dyer Dips Trading provides an excellent animated explanation of the logic behind this cycle. It visualizes why the manipulation phase is a necessary step before the true move can begin.
Watch the segment from 01:05 to 03:12. Pay close attention to the explanation of how liquidity builds on both sides of the accumulation range and how the 'Judas Swing' is used to capture it.
4. Identifying the Power of 3 on Your Charts
Recognizing this cycle in real-time is the key to applying it. The PO3 concept is fractal, meaning it appears on various timeframes, but its name comes from its application to the daily candle's structure: the Open, High, Low, and Close (OHLC).
The Daily Candle as a PO3 Cycle
The AMD cycle is what forms the daily candle's body and wicks.
- The opening price is the baseline.
- The manipulation move forms the wick (either the high or low of the day).
- The distribution move forms the body of the candle, pushing to the closing price.
Let's watch how this plays out in practice, first by looking at the daily candle itself and then on lower intraday timeframes. The following clips from TTrades offer clear, narrated examples.
Please watch the following segments: Daily Candle (06:28 - 08:19): See how the London session manipulation sets the low of the day, creating the daily candle's lower wick, before the New York session distributes higher. Intraday Example (03:23 - 05:06): Watch a full AMD cycle play out on a 1-minute chart. Practical Tip (11:34 - 13:23): This part offers a crucial tip: If you struggle to find the 'Accumulation' range, focus first on identifying the aggressive 'Manipulation' move, then look back to define the range it broke out from.
By learning to see the daily session through this three-act structure, you can better position yourself to enter during the distribution phase, after the manipulation has likely concluded.
Conclusion
You have now learned the foundational blueprint for daily price action: the Power of 3. This model provides a narrative structure that synthesizes the concepts of liquidity and market structure into a coherent, repeatable cycle.
Key Takeaways:
- The Power of 3 consists of Accumulation, Manipulation, and Distribution (AMD).
- Accumulation builds liquidity and allows institutions to enter positions quietly.
- Manipulation (the Judas Swing) is a false move that engineers liquidity by trapping traders and hunting stops.
- Distribution is the true, high-momentum move of the session, aligned with the daily bias.
- This cycle explains the formation of the daily candle's wicks (manipulation) and body (distribution).
Preview of the Next Lesson:
We've now defined the entire Power of 3 cycle. In the upcoming lessons, we will break it down piece by piece to make it actionable. We'll start by learning how to specifically identify the accumulation phase on intraday charts, which is the first step in preparing for the manipulation and subsequent distribution.