Hello! Welcome to the next lesson in our module on The Power of 3 and Daily Bias.
In the last lesson, we introduced the Power of 3 (AMD) as a complete narrative for daily price action, comprising Accumulation, Manipulation, and Distribution. You learned the purpose of each phase and saw how they combine to form the daily candle.
Today, we will zoom in on the very first stage of this cycle. Our goal is to master the skill of identifying the accumulation phase on intraday charts. This is the foundational step in applying the Power of 3 model, as recognizing the initial consolidation is what allows you to anticipate the manipulation and distribution that follow.
1. What is the Accumulation Phase?
As we briefly covered, the accumulation phase is the quiet beginning of the daily story. It's a period of consolidation where "smart money" is thought to be strategically building their large positions without causing significant price movement. This sideways action serves a dual purpose: it allows them to enter the market discreetly and, crucially, it builds liquidity on both sides of the range.
What Is the ICT Power of 3 (PO3) Strategy, and How Do Traders Use It?
Let's start with a clear, detailed definition of this phase. The following article from FXOpen explains the characteristics of the accumulation phase and its role in the broader Power of 3 strategy.
Please read the sections titled 'The ICT Power of 3 (PO3)' and 'The Accumulation Phase'. Focus on the description of price behavior (low volatility, sideways movement) and the stated goal of institutional investors during this time.
This phase of consolidation is where buy-side liquidity (buy stops) builds above the range highs and sell-side liquidity (sell stops) builds below the range lows. These liquidity pools become the targets for the next phase: manipulation.
The image below shows a schematic of a bullish AMD cycle. Notice how the accumulation phase is depicted as a tight, sideways range near the opening price.

2. Visual Characteristics on a Chart
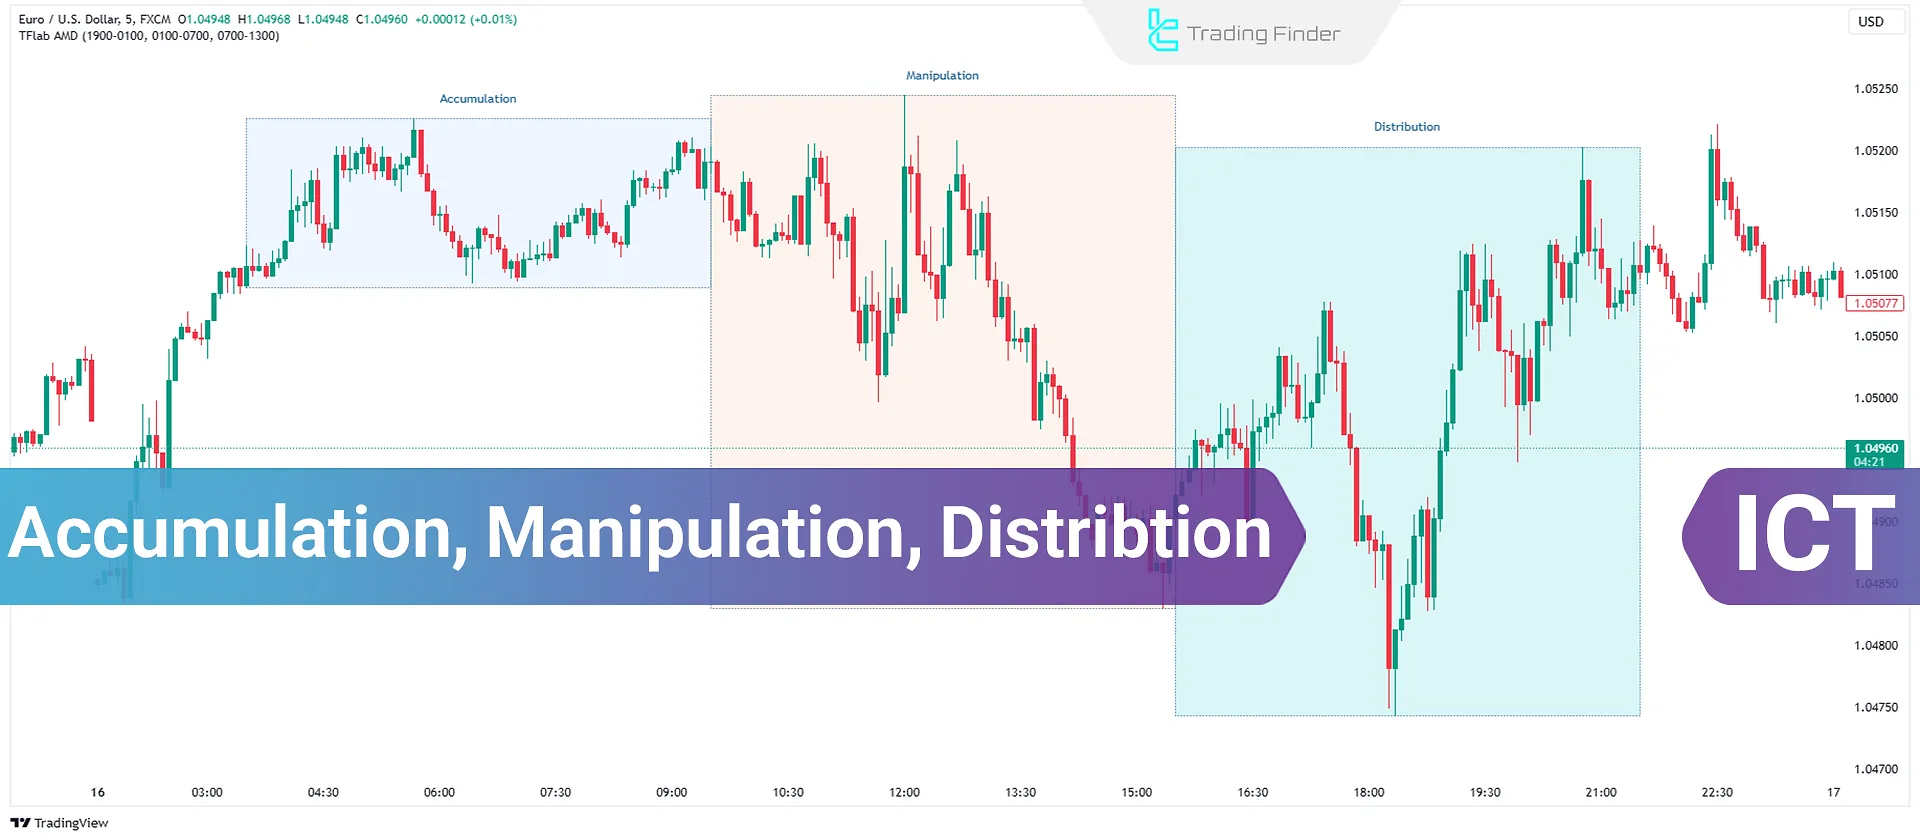
On your charts, the accumulation phase appears as a clear range or consolidation zone. Price will seem directionless, often bouncing between a discernible high and low without making significant progress.
Look for:
- Sideways price action: The chart moves more horizontally than vertically.
- A "boxy" appearance: You can easily draw a rectangle around the highs and lows of the price action.
- Lack of displacement: There are no strong, impulsive moves that break out and continue in one direction.
The chart below shows a real-world example on a 5-minute EUR/USD chart. The area marked "Accumulation" clearly displays the sideways, range-bound characteristics we've discussed.
3. When and Where to Look for Accumulation
While accumulation can happen at any time, it most frequently occurs during periods of lower market volatility. This gives you a specific time window to watch for its formation.
The Asian trading session is the classic example. For major pairs like EUR/USD and GBP/USD, the Asian session is typically the quietest. This low-volume environment is ideal for smart money to accumulate positions and for a clean consolidation range to form. This range then becomes the "playing field" for the more volatile London and New York sessions.
SMC Secrets EXPOSED With Power Of Three
To understand the relationship between trading sessions and the accumulation phase, let's watch a short clip. This video from Smart Risk explains why the Asian session often serves as the day's primary accumulation period.
Watch the segment from 10:03 to 10:49. The presenter discusses how the euro-dollar pair often consolidates during the Asian session, setting the stage for moves in the London session.
Beyond the Asian session, you may also find smaller accumulation ranges forming in the hour or two leading up to the London open or the New York open, as the market pauses and gathers energy before the session's main move.
4. Practical Techniques for Identification
Now, let's get practical. How do you consistently spot this phase on your charts?
The most direct way is to look for the consolidation range during the time windows we just discussed. However, sometimes the range isn't perfectly clean. A powerful alternative technique is to work backward from the manipulation.
If you spot a sharp, aggressive, and ultimately failing breakout (the manipulation), look immediately to the left on your chart. The consolidation that price broke out from is your accumulation range.
The following video from TTrades provides several excellent examples of identifying accumulation ranges and demonstrates the 'work backward' technique.
Please watch the following clips: Example 1 (03:23 - 03:57): See a clear consolidation range being marked out on a 1-minute chart. Example 2 (06:37 - 06:52): Notice the accumulation forming as the London session begins. 'Work Backward' Technique (11:34 - 13:09 & 13:23 - 14:07): This is the key part. Pay close attention to how the presenter first identifies the aggressive price action (manipulation) and then uses it to define the accumulation range it came from. This is an extremely effective method.
This "work backward" method is invaluable because it uses the most obvious part of the cycle (the aggressive manipulation) to define the more subtle part (the accumulation).
Conclusion
You now have a detailed framework for identifying the first and most crucial phase of the Power of 3 cycle. By spotting the accumulation range, you are essentially identifying the battlefield where liquidity is being engineered.
Key Takeaways:
- The accumulation phase is a period of consolidation where smart money builds positions and liquidity gathers above the highs and below the lows.
- Visually, it appears as sideways, range-bound price action on intraday charts.
- It most commonly occurs during the Asian session or in the periods just before the London or New York opens.
- You can identify it by looking for these consolidation zones directly or by using the powerful technique of working backward from an obvious manipulation move.
Preview of the Next Lesson:
Now that you can confidently identify the accumulation range, our next lesson will focus on the second act of the daily narrative. We will learn to recognize the manipulation phase (the "Judas Swing"), which is the false move designed to trap traders and hunt the liquidity you've just learned to identify.