Introduction
In our previous lesson, we established how to identify a valid London Swing that signals a continuation of the higher-timeframe trend. You learned to read the London session not just for reversals, but for powerful confirmations of existing order flow.
Today, we will build directly on that foundation. This lesson is about execution. Your goal is to learn how to execute trades using the New York session continuation model, which leverages the directional bias set by the London Swing. We'll move from identifying the context to taking action within a specific, high-probability framework that bridges the London and New York sessions.
1. The Logic: London Reversal Sets Up New York Continuation
The New York session doesn't happen in a vacuum; its behavior is often a direct reaction to what occurred in London. For our purposes, there are two primary scenarios:
- London Trend -> New York Reversal: If the London session trends strongly in one direction without a significant pullback, the market is over-extended. New York is then more likely to engineer a reversal.
- London Reversal -> New York Continuation: If the London session has already performed a reversal (e.g., a Judas Swing that sweeps Asian session liquidity and then changes direction), it has established the likely true direction for the day. New York is then likely to provide a continuation of this new trend.
Our focus today is on the second, higher-probability scenario. The "London Swing" for continuation you learned to identify is, in essence, the "London Reversal" that sets the stage for the New York continuation.
To understand this dynamic better, let's explore the underlying logic.
The Ultimate ICT/SMC Strategies for London & NewYork Killzone [Full In-Depth Guide]
The video 'The Ultimate ICT/SMC Strategies for London & NewYork Killzone' by Mulham Trading provides a clear, rule-based explanation for anticipating a continuation or reversal in New York.
Watch from 14:46 to 17:12. Focus on the core rule explained: 'London reversal means New York continuation'. This is the central thesis for the model we are learning today. Understand why a reversal within the London session gives us a strong clue for what to expect in New York.
2. The Daily Profile and Key Timings
This interplay between sessions forms a classic daily price profile. The London session creates the high or low of the day (the wick of the daily candle), and the New York session provides the expansionary move (the body of the daily candle).
- Bullish Day: London manipulates lower, sweeping sell-side liquidity and forming the low of the day (the bottom wick). New York then rallies, continuing the move initiated in London and forming the body of the daily candle.
- Bearish Day: London manipulates higher, sweeping buy-side liquidity and forming the high of the day (the top wick). New York then declines, continuing the move and forming the body.
The following video provides an excellent visual walkthrough of this exact profile.
ICT Daily Profile - London Reversal / New York Continuation
Let's watch 'ICT Daily Profile - London Reversal / New York Continuation' by TTrades. This will help you visualize how the London reversal and New York continuation create the daily candle.
Watch from 00:43 to 06:15. First, pay close attention to the introductory explanation (until 01:57) that links the session movements to the Open-High-Low-Close of the daily candle. Then, carefully observe the bullish and bearish chart examples. Note how in each case, London first creates a reversal, followed by an entry opportunity during the New York Killzone for a continuation trade.
3. The New York Continuation Model: A Step-by-Step Guide
Now, let's codify this into an executable trading model. We'll use a step-by-step approach to identify the setup, find an entry, and manage the trade.
Here are the two primary scenarios you'll encounter, as detailed in the article "ICT 2022 Mentorship – Best ICT Trading Strategies Explained."
ICT 2022 Mentorship – Best ICT Trading Strategies Explained
This article from TradingFinder provides a structured breakdown of how to trade the New York session based on London's action. We will use it as our guide.
Please read the two sections under 'New York Session Trading Strategy': 'Liquidity Sweep in the London Session' 'Remaining of the London Session in a Limited Range' Focus on the step-by-step instructions provided for each scenario. This gives you a clear checklist for execution.
Let's synthesize this information and visualize the model.
Scenario 1: London Sweeps Liquidity (The Classic Model)
This is the most common and powerful version of the setup.
Step 1: Context - The London Swing is Confirmed
- Before the New York Killzone (7 AM - 10 AM EST), you have already identified that the London session has swept a major liquidity level (like the Asian session high/low) and produced a Market Structure Shift (MSS) in the opposite direction.
- The HTF bias, the London Swing, and the draw on liquidity are all aligned.
Step 2: Anticipation - The New York "Judas Swing"
- As the New York session opens, do not chase the price. Expect a manipulative move against the direction established by London.
- This is a smaller, fractal version of the Judas Swing. Its purpose is to induce traders onto the wrong side or run stops on early positions before the true continuation begins. For example, in a bullish scenario, this would be a small sell-off at the NY open.
Step 3: Entry - The Retracement to a PD Array
- This manipulative swing pushes the price back into a high-probability PD Array created during the London move. This is your entry zone. Look for:
- A Fair Value Gap (FVG)
- An Order Block or Breaker Block
- An Optimal Trade Entry (OTE) level using the Fibonacci tool, measured on the London Swing.
Step 4: Execution - Placing the Trade
- Entry: Execute your trade as price mitigates the PD Array.
- Stop Loss: Place it logically behind the structure you are trading from. For a bullish entry from an FVG, the stop would go below the low of the swing that created the FVG.
- Targets: Aim for the next significant draw on liquidity in the direction of your trade (e.g., the opposing Asian session level, or a HTF swing high/low).
Let's look at how this model appears on a chart.
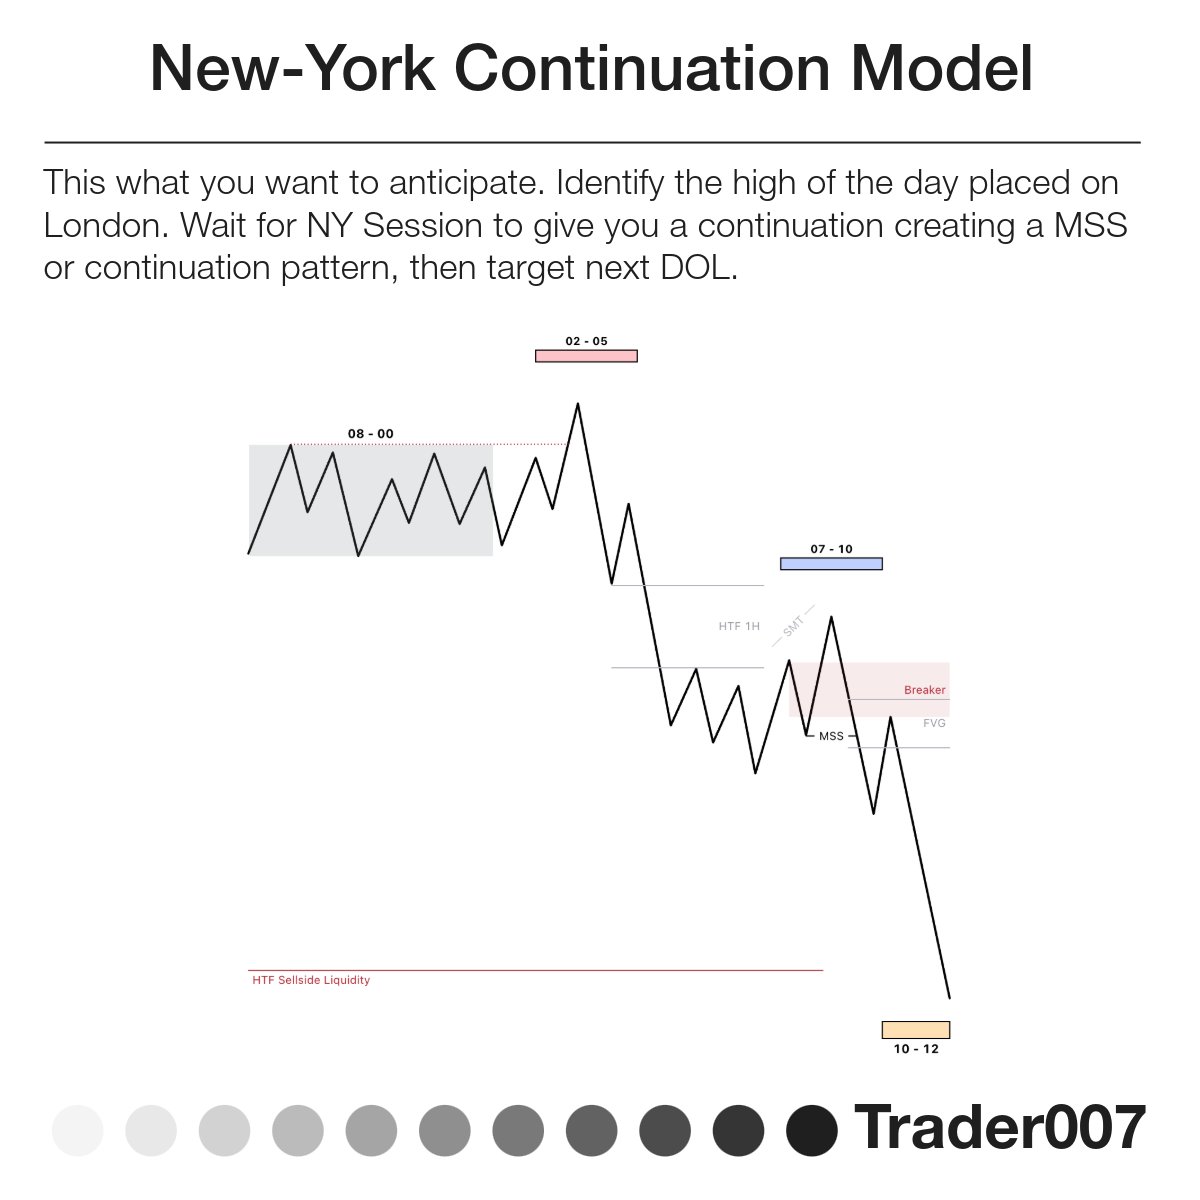
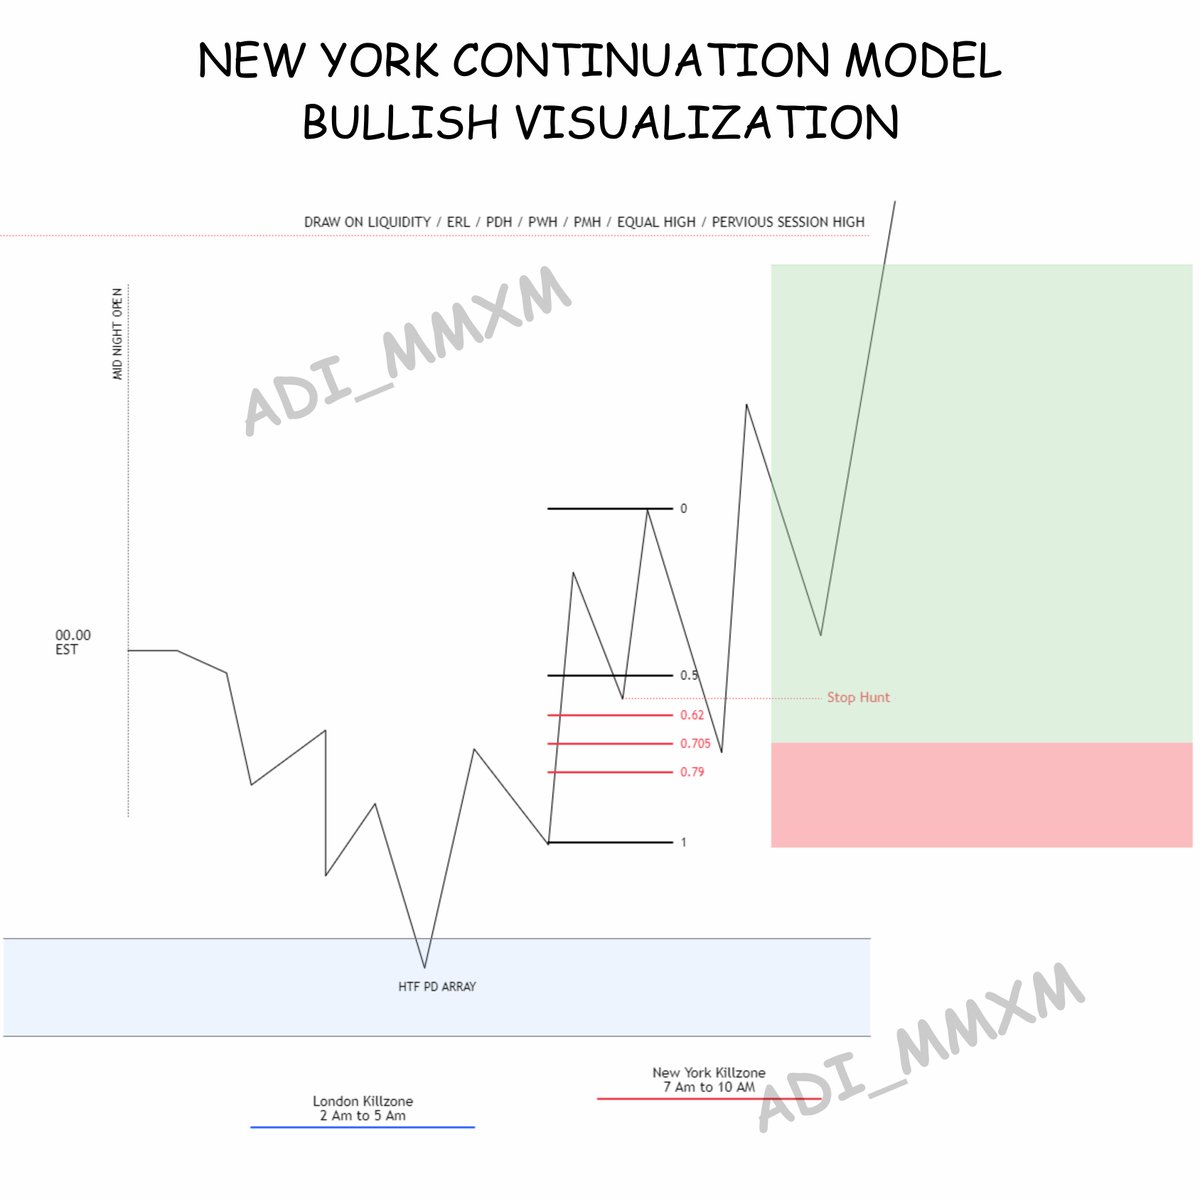
4. Walkthrough of an Execution
Let's re-examine one of the examples from the Mulham Trading video and apply our execution model step-by-step.
The Ultimate ICT/SMC Strategies for London & NewYork Killzone [Full In-Depth Guide]
Let's re-watch an example from the Mulham Trading video, but this time with our execution framework in mind.
Watch the first example presented, from 17:12 to 19:20. As you watch, try to identify the four steps of our model.
Let's break down that example together:
- Context (London Swing): The Asian high is taken during the London Killzone. Price aggressively displaces lower, creating a Market Structure Shift. This establishes a bearish bias for the rest of the day. The video notes that price also reversed within the London session.
- Anticipation (NY Judas Swing): As the New York session approaches, the model anticipates a continuation lower. The manipulative move happens right around the 9:30 AM equities open, where price rallies to take out a short-term high created during London.
- Entry (PD Array): This rally pushes price perfectly into the zone where the initial London reversal occurred. This is the entry area. An entry could be refined on a lower timeframe looking for an FVG or order block within that zone.
- Execution: A short entry is taken after the NY Judas Swing. The stop loss would be placed above the high of that swing. The target is the sell-side liquidity below, continuing the bearish move initiated in London.
By following this systematic process, you move from simply observing price action to engaging with it through a structured, repeatable model.
Conclusion
Today, you have learned a complete trading model for executing trades during the New York session that continue the trend established in London. This is a powerful way to synthesize your understanding of session timings, liquidity, and price delivery.
Key Takeaways:
- The New York Continuation Model is based on the premise: London Reversal -> New York Continuation.
- The execution framework involves four key steps:
- Confirm the London Swing has established a clear directional bias.
- Anticipate a manipulative New York "Judas Swing" against that bias.
- Identify the retracement into a key PD Array (FVG, Order Block, OTE) for your entry.
- Execute with a logical stop loss and target the next draw on liquidity.
- This model provides a structured way to trade the highest volume sessions of the day in alignment with institutional order flow.
Preview of the Next Lesson:
You now have several distinct ICT models in your arsenal: the 2022 Model, the Unicorn entry, the London Swing, and the New York Continuation. But how do you know which one to use on any given day? In our next lesson, we will focus on synthesis, learning how to compare the market contexts (expansion, reversal, retracement) suitable for each learned ICT model. This will help you build a pre-session checklist to select the highest probability model for the day's conditions.