Hello!
In our last lesson, we explored why certain ICT models are suited for specific market contexts—reversal, retracement, or expansion. We established that the key to successful trading is not just knowing the patterns, but understanding the market's current story.
Today, we transition from theory to a professional, repeatable practice. The goal of this lesson is to build a pre-session checklist to select the highest probability model for the day. This routine will be your foundation for every trading session, transforming you from a reactive pattern-hunter into a proactive, hypothesis-driven trader. By the end of this lesson, you will have a clear, step-by-step process for analyzing the market and forming a robust daily trading plan.
1. The Purpose of a Pre-Session Checklist
A pre-session checklist is not about predicting the future with certainty. It's about preparation, risk management, and stacking probabilities in your favor. A well-constructed checklist helps you:
- Establish a Directional Bias: Form a data-driven opinion on where the market is most likely to go.
- Frame a Narrative: Create a "story" for the day's price action, anticipating potential manipulation and the true expansion move.
- Identify Key Levels: Mark the significant price points where you expect reactions.
- Select the Right Tool: Logically choose the ICT model that best fits the anticipated narrative.
- Manage Psychology: By having a plan before the session begins, you reduce emotional decision-making and the fear of missing out (FOMO).
This process is the hallmark of a professional trader. Let's build it step by step.
2. The ICT Day Trade Routine: A Top-Down Approach
The most robust analysis starts from a high-level, macro perspective and drills down to the details. We will follow the core routine taught by ICT himself.
To see this entire process explained by its creator, I highly recommend you watch this detailed video. We will break down the key steps, but seeing them performed will provide invaluable context.
ICT Mentorship Core Content - Month 09 - ICT Day Trade Routine
The video 'ICT Mentorship Core Content - Month 09 - ICT Day Trade Routine' by The Inner Circle Trader is a masterclass in pre-session analysis. It provides the complete top-down framework that we will be building our checklist on.
Watch the video from the beginning until 32:54. You don't need to absorb every single detail on the first watch. Instead, focus on the sequence of the analysis: Checking the economic calendar. Analyzing the Dollar Index (DXY) for overall market direction. Drilling down into the specific currency pair (EURUSD in this case) on the Daily, 4H, and 1H charts. Identifying PD Arrays and determining if the price is at a premium or discount. Notice how he builds a story by combining these elements before ever thinking about an entry.
Drawing from that video and other resources, let's structure this routine into a clear checklist format.
3. Your Pre-Session Checklist
Step 1: The Macro Context ("When")
Before you look at a single chart, you must know what might move the market.
- Action: Check the economic calendar (e.g., on ForexFactory.com or Investing.com) for the upcoming session.
- Question: Are there any high-impact (red folder) or medium-impact (orange folder) news events scheduled during the London or New York Killzones?
- Why it Matters: High-impact news injects massive volatility. These events are often used by the algorithm to engineer liquidity sweeps (manipulation). Knowing the timing of news helps you anticipate when these moves are likely to occur and can prevent you from being caught on the wrong side.
Step 2: The Higher-Timeframe Narrative ("Why")
This is the most critical part of your analysis. It sets your directional bias for the day. You'll primarily use the Daily (D1) and 4-Hour (4H) charts.
-
Action A: Determine Institutional Order Flow.
- Questions: Is the market making higher highs and higher lows (bullish) or lower lows and lower highs (bearish)? Are HTF order blocks and fair value gaps being respected or violated?
- Why it Matters: This establishes the path of least resistance. You want to be trading in alignment with the larger institutional flow.
-
Action B: Identify the HTF Draw on Liquidity.
- Question: Where is price most likely to reach for next? Is it an old swing high/low (External Range Liquidity) or is it retracing into a deep-discount FVG or Order Block (Internal Range Liquidity)?
- Why it Matters: This gives your trade a logical target and a reason to exist. Price moves with purpose—your analysis should define that purpose.
-
Action C: Analyze the Premium/Discount Array.
- Questions: Within the current dealing range on the Daily/4H chart, is price currently trading in a premium (above 50% equilibrium) or a discount (below 50%)?
- Why it Matters: In a bullish order flow, you want to be buying at a discount. In a bearish order flow, you want to be selling at a premium. This concept keeps you from chasing price and helps you enter at favorable levels.
For a concise summary of these first few steps, the following reading is an excellent reference.
How To Identify Daily Bias Using ICT Concepts
The article 'How To Identify Daily Bias Using ICT Concepts' from City Traders Imperium provides a clear, structured guide to forming your directional hypothesis.
Read the section 'How to Determine Daily Bias Using ICT Concepts'. It covers the key steps we've just discussed: analyzing order flow, identifying liquidity pools, recognizing institutional arrays (OBs/FVGs), and considering the macro environment. This reinforces the core of your HTF analysis.
Step 3: The Intraday Context ("Where")
Now, drop down to the 1-Hour (1H) and 15-Minute (15M) charts to mark the key levels for the upcoming session.
-
Action A: Mark Key Structural Levels.
- Levels to mark: Previous Day's High (PDH), Previous Day's Low (PDL), Previous Week's High (PWH), and Previous Week's Low (PWL).
- Why it Matters: These are massive liquidity pools that often act as magnets for price.
-
Action B: Mark Session Liquidity.
- Levels to mark: The Asian Session High and Low. Before the New York open, also mark the London Session High and Low.
- Why it Matters: The Asian range is often the "accumulation" phase for the Power of 3. Its highs and lows are prime targets for the "manipulation" phase in the London or New York sessions.
-
Action C: Identify Key Intraday POIs (Points of Interest).
- Levels to mark: Note any clean Fair Value Gaps, Order Blocks, or Breaker Blocks on the 1H/15M charts that align with your HTF directional bias and are near your expected manipulation points.
- Why it Matters: These will be your high-probability zones for trade entries.
The following video provides a more modern and rapid-fire approach to this intraday checklist, focusing on indices. The principles are universal and perfectly complement the foundational routine from ICT.
Pre-AM Market CHECKLIST | ICT Concepts
The video 'Pre-AM Market CHECKLIST' by flux trades offers a very practical, bite-sized guide to marking up your intraday chart.
Watch the segments from 00:18-03:44 and 07:05-08:40. He covers: Daily/4H bias. 1H order flow. Marking the London swing high/low. Marking the closest high/low to the 8:30 AM news driver. The importance of being aware of news drivers. This is a great example of applying the concepts in a fast-paced, pre-market environment.
4. Synthesizing and Selecting Your Model
With your analysis complete, you synthesize it into a primary hypothesis. This story dictates which model you will be looking for.
Example Hypothesis:
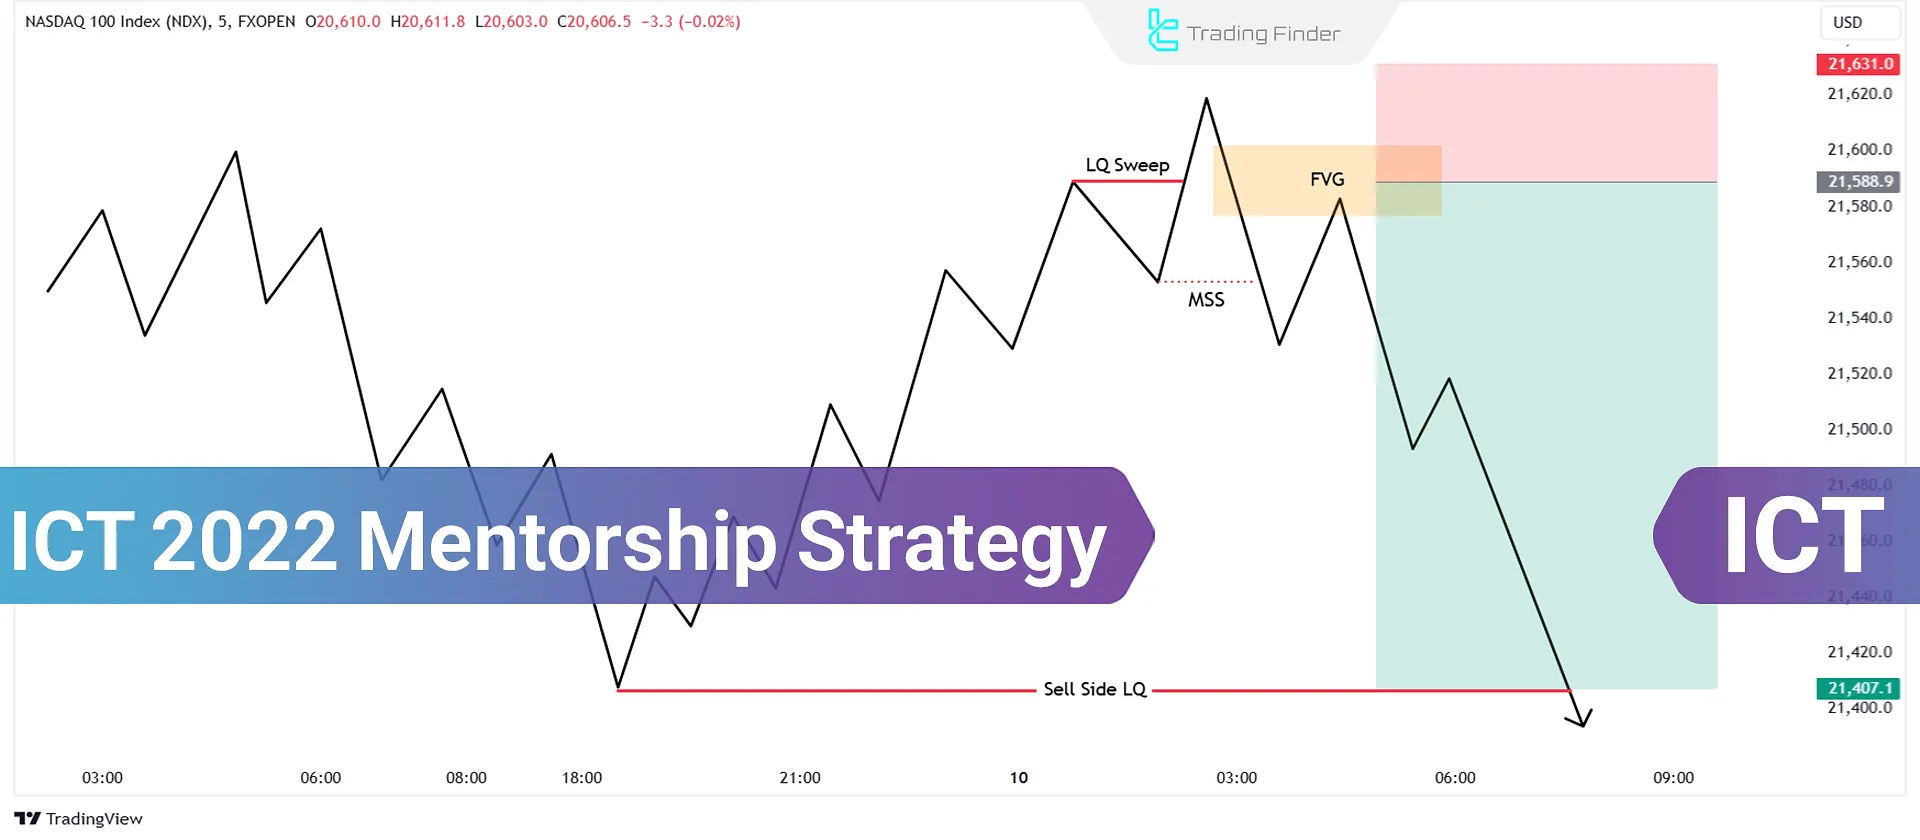
"The Daily chart is bullish and we are trading in a discount. The draw on liquidity is the Previous Week's High. The Asian session consolidated, creating a clean range. Therefore, my daily bias is bullish. I anticipate a manipulative move below the Asian Range low during the London Killzone to sweep sell-side liquidity and mitigate a 1H bullish Order Block. After that sweep, I will look for a Market Structure Shift on the 5M chart."
Based on this hypothesis, what model is the most logical choice?
The ICT 2022 Mentorship Model. It fits the narrative perfectly: a liquidity sweep, a market structure shift, and then an entry on the retracement to target a higher timeframe objective.
Let's link this back to the market contexts from our last lesson:
- If your hypothesis involves a sweep of a major HTF level followed by a reversal, you're looking for a Turtle Soup or the initial setup of the 2022 Model.
- If your hypothesis involves price continuing an established trend, you're looking for a retracement into a POI for an OTE, a NY Session Continuation, or the entry portion of the 2022 Model.
- If the time is between 10-11 AM EST and there is clear, nearby liquidity, the Silver Bullet model becomes a candidate.
5. The Final Checklist
Here is a concise version of the pre-session checklist you can use every day.
My Pre-Session Trading Checklist
1. Macro Environment:
- High/Medium Impact News Events & Times: ___________________
2. Higher-Timeframe Analysis (D1/4H):
- Institutional Order Flow: ( ) Bullish / ( ) Bearish
- Primary Draw on Liquidity: ___________________
- Current Dealing Range Context: ( ) Premium / ( ) Discount
3. Intraday Analysis (1H/15M):
- Key HTF Levels Marked: ( ) PDH/L, ( ) PWH/L
- Key Session Levels Marked: ( ) Asia High/Low, ( ) London High/Low
- High-Probability POIs in alignment with Bias: ___________________
4. Daily Bias & Hypothesis:
- My bias for today is: ( ) Bullish / ( ) Bearish
- The likely "story" is: __________________________________________________
5. Primary ICT Model(s):
- Based on my hypothesis, I am looking for: ___________________
6. Invalidation Point:
- My bias would be wrong if price breaks above/below: ___________________
Conclusion
You have now built a professional, systematic routine for preparing for your trading day. This checklist is the bridge between all the concepts you've learned and their practical application. It forces you to think in probabilities, build a narrative, and trade with intent.
Key Takeaways:
- A pre-session routine is non-negotiable for consistent trading.
- Your analysis must be top-down: start with the macro environment, establish a HTF bias, and then mark key intraday levels.
- Your Daily Bias is a hypothesis about the day's price delivery narrative (Accumulation, Manipulation, Distribution).
- The chosen ICT model should be a logical consequence of your hypothesis, not a randomly spotted pattern.
Preview of the Next Lesson:
With this checklist, you can now anticipate the likely daily narrative. In our final lesson of this module, we will take this one step further. We will focus on how to synthesize time, price, and liquidity analysis to anticipate the daily price delivery algorithm in real-time, adapting your plan as the session unfolds.