Hello! Welcome to the final lesson in our "Advanced Concepts and Model Integration" module.
In our last session, we created a systematic pre-session checklist. That checklist is your strategic map, helping you form a robust hypothesis for the trading day before the market even opens. You learned to establish a bias, identify the draw on liquidity, and select a potential ICT model that fits your narrative.
Today, we take the final step. We move from the static, pre-market plan to a dynamic, real-time understanding of price delivery. The learning outcome for this lesson is to synthesize time, price, and liquidity analysis to anticipate the daily price delivery algorithm. This is the pinnacle of the ICT analytical process, where you learn to read the market's story as it unfolds, scene by scene.
1. The Daily Price Delivery Algorithm: What Is It?
At the heart of ICT's methodology is the idea that price movement is not random. It is driven by a set of instructions—a conceptual "algorithm"—that delivers price to specific levels in a specific, time-based manner. ICT refers to this as the Interbank Price Delivery Algorithm (IPDA).
Think of it like this: your pre-session checklist helps you predict the plot of a movie (e.g., "a bullish reversal story"). Synthesizing time, price, and liquidity in real-time is like watching the movie and recognizing the plot points—the setup, the conflict, the climax—as they happen.
The IPDA operates in a cycle with four primary phases:
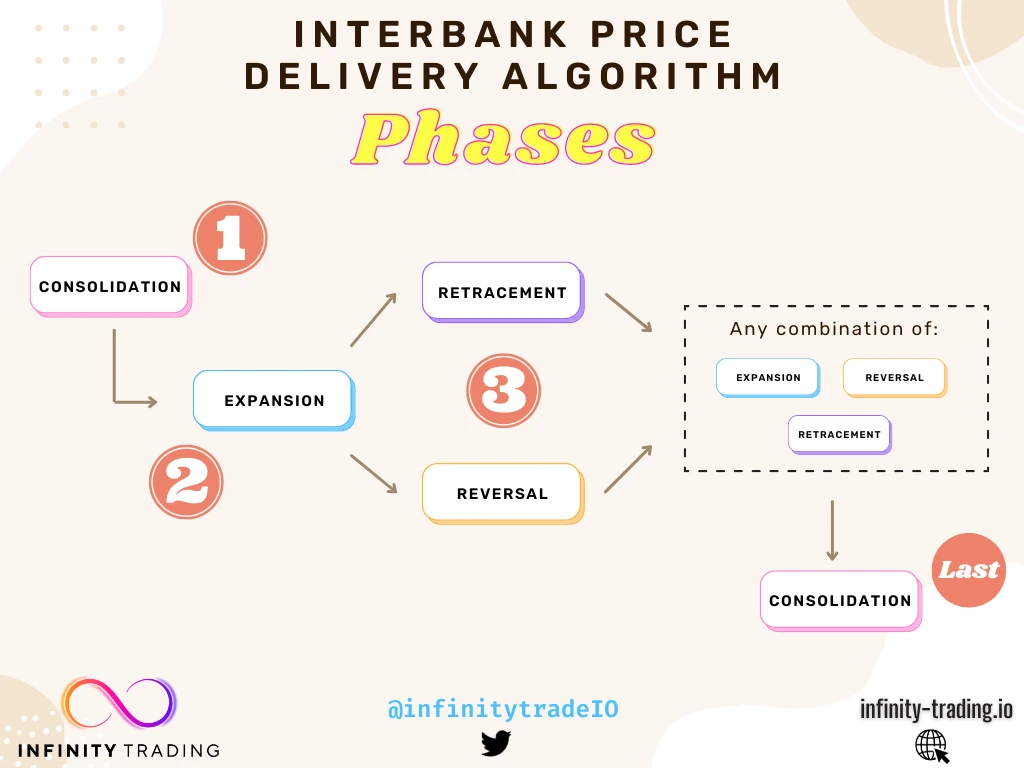
The algorithm's primary objectives are always the same:
- Seek Liquidity: Move to areas where stop orders and pending orders are clustered (e.g., above old highs or below old lows).
- Rebalance Inefficiencies: Return to price ranges where aggressive buying or selling left imbalances, or Fair Value Gaps (FVGs).
The rest of this lesson is about how to anticipate this process by synthesizing the three core pillars of ICT analysis.
2. The Three Pillars of Synthesis
To anticipate the daily algorithm, you must constantly analyze and combine information from three distinct but interconnected pillars.
Pillar 1: Price (The Framework)
Price action creates the map of your trading environment. It tells you the market's structure and highlights the specific levels of interest. This map is built from concepts we've covered extensively:
- Market Structure (HTF): Establishes your directional bias. Is the market bullish (higher highs/lows) or bearish (lower lows/highs)?
- Premium & Discount: Tells you where to engage. You want to buy in a discount and sell in a premium relative to the current dealing range.
- PD Arrays: These are the specific coordinates on your map—the Order Blocks, Fair Value Gaps, Breaker Blocks, and Mitigation Blocks where you expect the algorithm to react.
Your pre-session checklist helps you create this map. Throughout the day, you watch to see how price interacts with it.
Pillar 2: Liquidity (The Fuel)
If price is the map, liquidity is the fuel that makes the car go. The algorithm is constantly seeking liquidity to facilitate large institutional orders. This is the "why" behind price movement. The most important daily pattern of liquidity engineering is the Power of 3 (PO3).
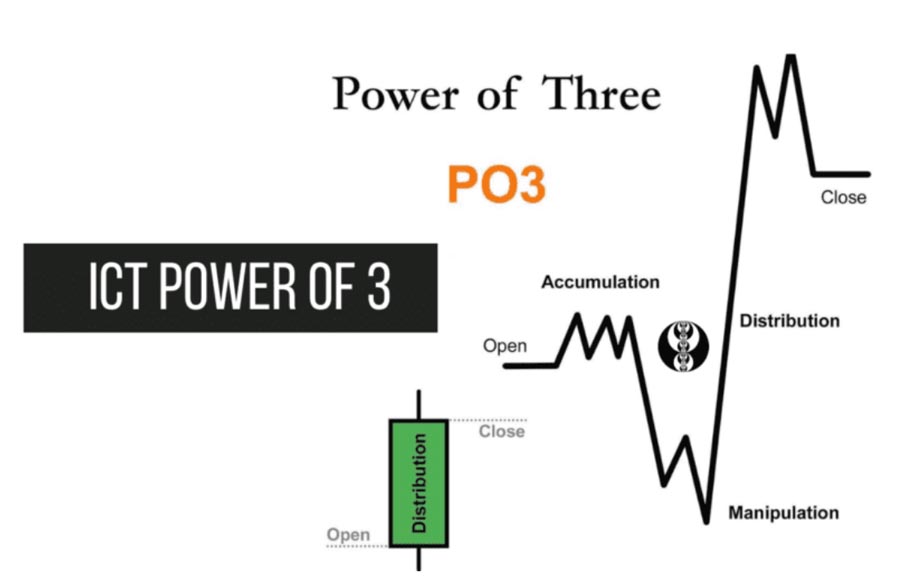
By combining your daily bias (from your Price analysis) with the PO3 concept, you can begin to anticipate the daily narrative. For example, if your bias is bullish, you should expect a manipulative move downward first to grab sell-side liquidity before the true upward move begins.
Pillar 3: Time (The Catalyst)
Time is the most critical and final filter. The algorithm is time-based. Price doesn't just move to a level; it moves to a level at a specific time. You've learned about Killzones, but there's a deeper layer: Macros.
A Macro is a specific, short window of time where the algorithm is programmed to execute a particular directive, such as initiating a run for liquidity or creating a reversal. Understanding these time windows allows you to anticipate when the manipulation or distribution phases are most likely to begin.
Let's hear about this directly from ICT.
ICT Mentorship 2023 - Algorithmic Price Delivery & Time Macros Intro
In this video, 'Algorithmic Price Delivery & Time Macros Intro', ICT explains the foundational concept that the markets are driven by an algorithm that operates on time. This is a crucial and advanced topic.
Watch the following key segments: The Role of Time (13:29 - 16:05): Pay close attention to how ICT describes the different time-based elements (Killzones, Silver Bullet, Macros) and how they fit together. Algorithm & Time (16:05 - 19:07): Focus on his core message here: the markets are not random, and time is the first crucial factor before price will move. This is the central idea of this lesson. Specific Macros (19:07 - 30:05): Listen as he discusses the 9:50-10:10 AM and 10:50-11:10 AM macros. You don't need to memorize them all right now. The goal is to understand that these are specific, repeatable time windows where the algorithm becomes active. The Purpose of Macros (30:05 - 35:49): He explains that a macro is when price begins to 'spool' or reach for liquidity/inefficiency. It's the start of the move.
As ICT states, knowing these times won't give you the direction. The direction comes from your analysis of Price and Liquidity. Time simply tells you when to pay attention for the story to unfold.
3. Putting It All Together: A Daily Narrative
Let's walk through a classic sell-day scenario to see how these three pillars synthesize in practice.
-
The Plan (Pre-Session Checklist):
- Price: HTF analysis shows a bearish market structure. Price is currently trading at a premium of the daily range.
- Liquidity: The primary draw on liquidity is an old weekly low. The Asian session has created a tight consolidation, building buy-side liquidity above its high and sell-side below its low.
- Hypothesis: Daily bias is bearish. I anticipate a Power of 3 scenario: a manipulative move up during the London Killzone to sweep the Asian high, followed by the true bearish move for the day.
-
The Execution (Real-Time Synthesis):
- (Time) The London Killzone (2 AM - 5 AM EST) begins.
- (Liquidity) Price rallies, breaking above the Asian session high. This is the potential manipulation (Judas Swing). Retail breakout traders are likely buying this move.
- (Price) The upward move reaches into a 15M Bearish Order Block within the premium zone identified earlier. The algorithm has now engineered liquidity and reached a logical level to reverse.
- (Synthesis) You see price aggressively sell off from the Order Block, breaking back below the Asian high and then breaking the swing low that started the upward move. This is your Market Structure Shift (MSS).
- (Action) The manipulation is confirmed. The distribution phase has begun. You now wait for a retracement back into a newly formed FVG (created by the aggressive down-move) to enter a short position, targeting the sell-side liquidity identified in your pre-session plan.
The following video provides an excellent walkthrough of this exact process.
ICT Power of 3 (PO3) Entry Model: Sniper Entries with DRT
The video 'ICT Power of 3 (PO3) Entry Model' by Ali Khan demonstrates a perfect synthesis of Time, Price, and Liquidity for a classic sell day.
Watch the segment from 02:30 to 09:06. Notice how he combines all the elements we've discussed: Time: He uses the 12:00 AM NY open as the start of the daily range and operates within the London and NY sessions. Liquidity: He identifies the raid on buy-side liquidity above the opening price (the manipulation). Price: He identifies the break of structure and enters on a retracement to a Fair Value Gap that overlaps with a bearish breaker and premium pricing. This is a textbook example of anticipating the daily price delivery algorithm.
4. IPDA Cycles and A Final Checklist
To round out your understanding, it's useful to know that ICT frames the IPDA within larger time cycles. This adds another layer to your HTF analysis.
Interbank Price Delivery Algorithm (IPDA), A Guide to ICT-Style Trading Concepts
The article 'Interbank Price Delivery Algorithm (IPDA)' on TradingFinder.com provides a great summary of the IPDA concept and its longer-term cycles.
Read the following sections: 'How does the Interbank Price Delivery Algorithm (IPDA) work?': This introduces the 20, 40, and 60-day lookback periods for identifying critical liquidity areas. 'Trading Strategy with 20, 40, and 60-Day Cycles': Focus on the table that explains the market behavior associated with each cycle. This helps frame your weekly and daily bias. 'IPDA Algorithm Execution Checklist': This provides a fantastic summary checklist for applying the IPDA concept, reinforcing everything in this lesson.
The checklist from the article provides a concise way to operationalize your synthesis:
- Determine bias based on price position within the 20, 40, 60-day ranges.
- Identify active imbalances (FVGs).
- Examine internal and external liquidity.
- Wait for a liquidity sweep or imbalance fill.
- Confirm entry within a Kill Zone after a market structure shift.
- Place stop loss behind the relevant structural point or unconsumed liquidity.
Conclusion
You have now reached the summit of ICT's analytical framework. You understand that anticipating price is not about finding one magic pattern. It's a continuous process of synthesis—weaving together the narratives told by Price, Liquidity, and Time. Your pre-session checklist gives you the plot, and your real-time analysis allows you to follow the characters and identify the turning points as they happen.
Key Takeaways:
- Price is delivered by a conceptual algorithm (IPDA) that follows a time-based schedule.
- The algorithm's purpose is to seek liquidity and rebalance inefficiencies.
- The Power of 3 (Accumulation, Manipulation, Distribution) is the daily blueprint for this process.
- Anticipation comes from synthesizing Price (the map), Liquidity (the fuel), and Time (the catalyst).
- Your daily bias is a hypothesis. You must wait for the market to provide evidence (e.g., a liquidity sweep and MSS) before acting.
Preview of the Next Module:
This lesson concludes our module on advanced concepts and model integration. You now have all the analytical tools needed to build high-probability trade ideas from start to finish.
In our next and final module, "Trade Management and Professional Development," we will shift our focus from finding and entering trades to what you do after you're in a position. We will cover critical topics like taking partial profits, managing your stop loss, systematic journaling, and building the mindset of a professional trader.