Hello! Welcome to the fourth lesson in the "Premium and Discount Arrays" module.
In our last lesson, we learned how to visually identify when price is trading at a premium (expensive) or a discount (cheap) relative to a price range. We established that the 50% equilibrium level is the key dividing line and that this context is crucial for framing high-probability trades.
Today, we transition from estimation to precision. The goal of this lesson is to master the practical skill of using the Fibonacci tool to mark premium and discount zones on a price range. This is not about using Fibonacci in a mystical way, but as a simple and effective measuring device—a core mechanical skill you will use daily as an ICT trader.
1. The Fibonacci Tool in the ICT Framework
In many trading circles, the Fibonacci tool is presented as a complex indicator with predictive powers. The ICT methodology simplifies this. Here, the Fibonacci tool is primarily used to objectively measure a price range and divide it into areas of value. It removes guesswork and subjectivity.
Let's begin by hearing from Michael Huddleston (ICT) himself on how he introduces the tool for this exact purpose.
ICT Mentorship Core Content - Month 1 - Equilibrium Vs. Discount
In this segment from 'ICT Mentorship Core Content - Month 1 - Equilibrium Vs. Discount', Michael introduces the Fibonacci tool specifically to illustrate the concept of equilibrium.
Watch from 00:01:29 to 00:05:58 and then from 00:08:39 to 00:10:48. Notice that he explicitly states the tool has no 'magic' on its own. His focus is on defining a range and finding its midway point, or 'equilibrium', which is the 50% level.
As you saw, the purpose is clear: to measure an impulsive price swing and identify its 50% equilibrium level. Everything above that level is considered premium, and everything below is considered a discount.
2. Configuring Your Fibonacci Tool
To use the tool like an ICT trader, you first need to set it up correctly on your charting platform (like TradingView). ICT uses a specific set of levels. While we are only focused on the 0, 0.5, and 1 levels today, it's efficient to configure all the standard ICT levels now.
This article provides the exact settings you'll need.
Fibonacci Levels in ICT Strategy – [TFlab] - Forex Factory
The article 'Fibonacci Levels in ICT Strategy' from Forex Factory details the specific levels used in the ICT framework.
Please find the section titled 'ICT Fibonacci Level Configuration'. Your task is to open the settings for your Fibonacci Retracement tool on your chart and add/edit the levels to match this list. You can also customize the colors to your liking.
For today's lesson, the most important levels from that list are:
- 1: The starting point of your price range.
- 0.5: The equilibrium level.
- 0: The ending point of your price range.
The other levels, such as 0.705 and 0.79, are for identifying the Optimal Trade Entry (OTE), a concept we will cover in-depth in a future module.
3. How to Draw the Fibonacci to Mark the Zones
With your tool configured, the next step is drawing it on a price range. The process is simple and depends on the direction of the price swing you are measuring.
Step-by-Step Guide:
- Identify a clear impulsive price swing. This range will be defined by a clear swing low and swing high.
- Anchor the tool based on the trend:
- For a bullish range (price moved up), you draw the Fibonacci tool from the swing low up to the swing high.
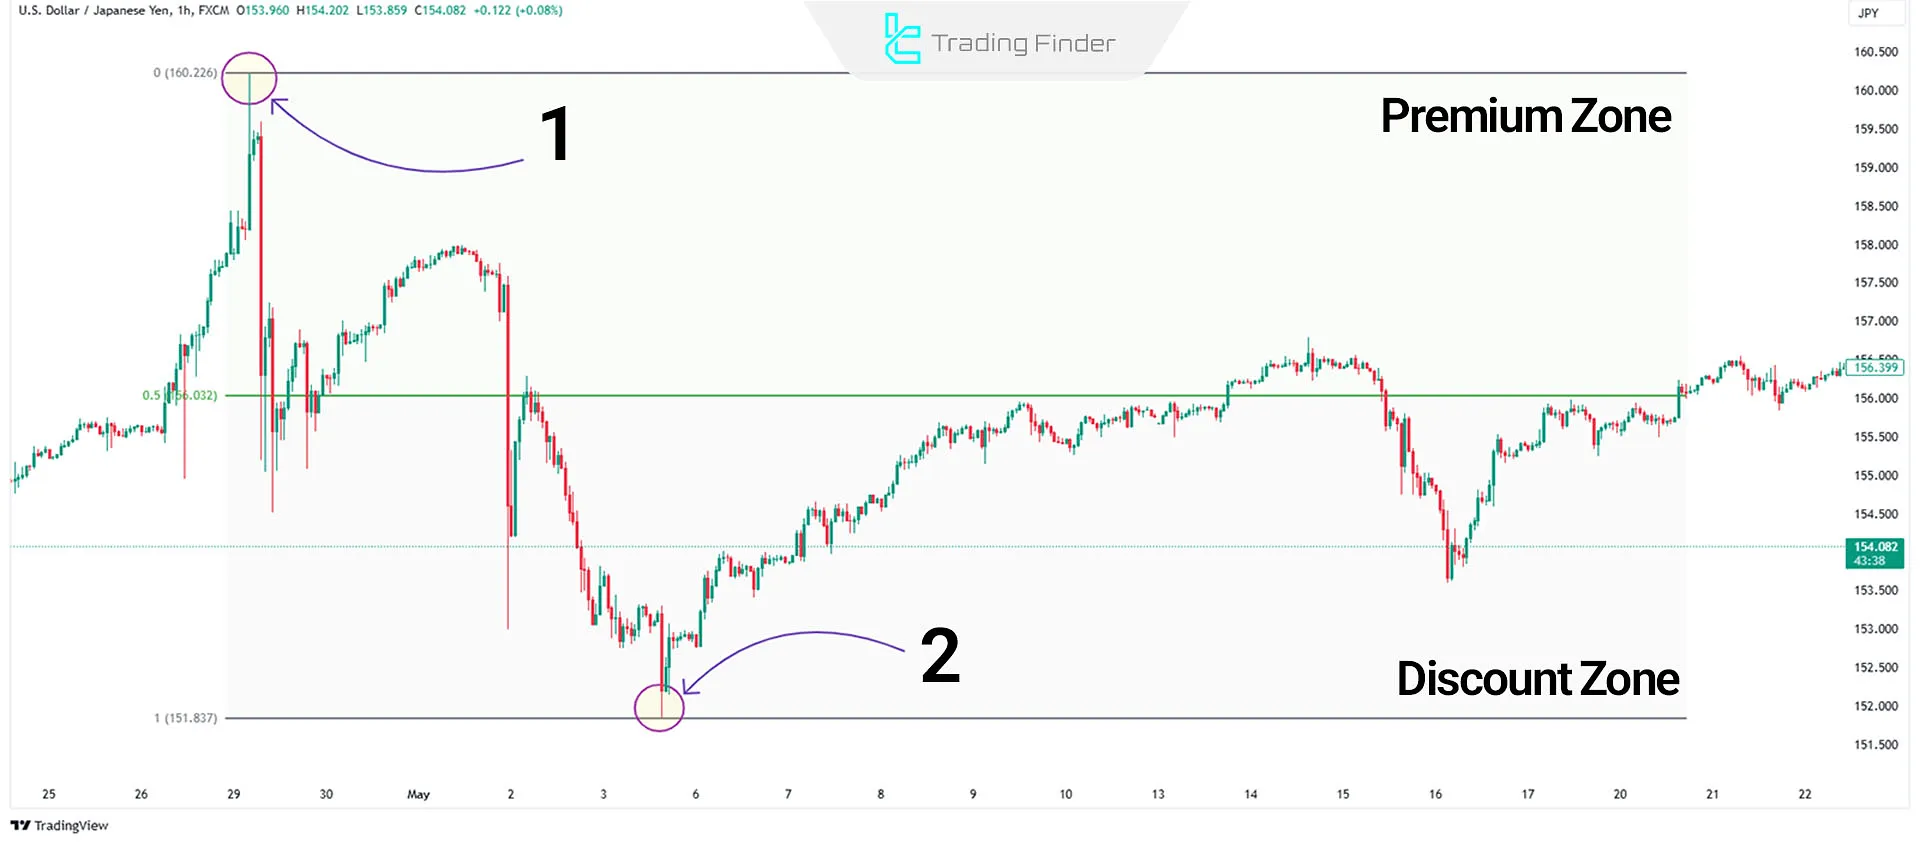
- For a bearish range (price moved down), you draw the Fibonacci tool from the swing high down to the swing low.
This short video provides a very clear demonstration.
The ONLY Premium and Discount Trading Guide Youll EVER Need
The video 'The ONLY Premium and Discount Trading Guide Youll EVER Need' by Tom Crown gives a concise, practical demonstration of applying the Fibonacci tool.
Watch from 00:00:21 to 00:01:03. Notice how the presenter anchors the tool from high to low or low to high to define the range, immediately showing the premium (above 0.5) and discount (below 0.5) zones.
Once drawn, you can instantly see the zones:
- The area above the 0.5 level is the Premium Zone.
- The area below the 0.5 level is the Discount Zone.
Let's look at two static examples.
Bullish Range Example:
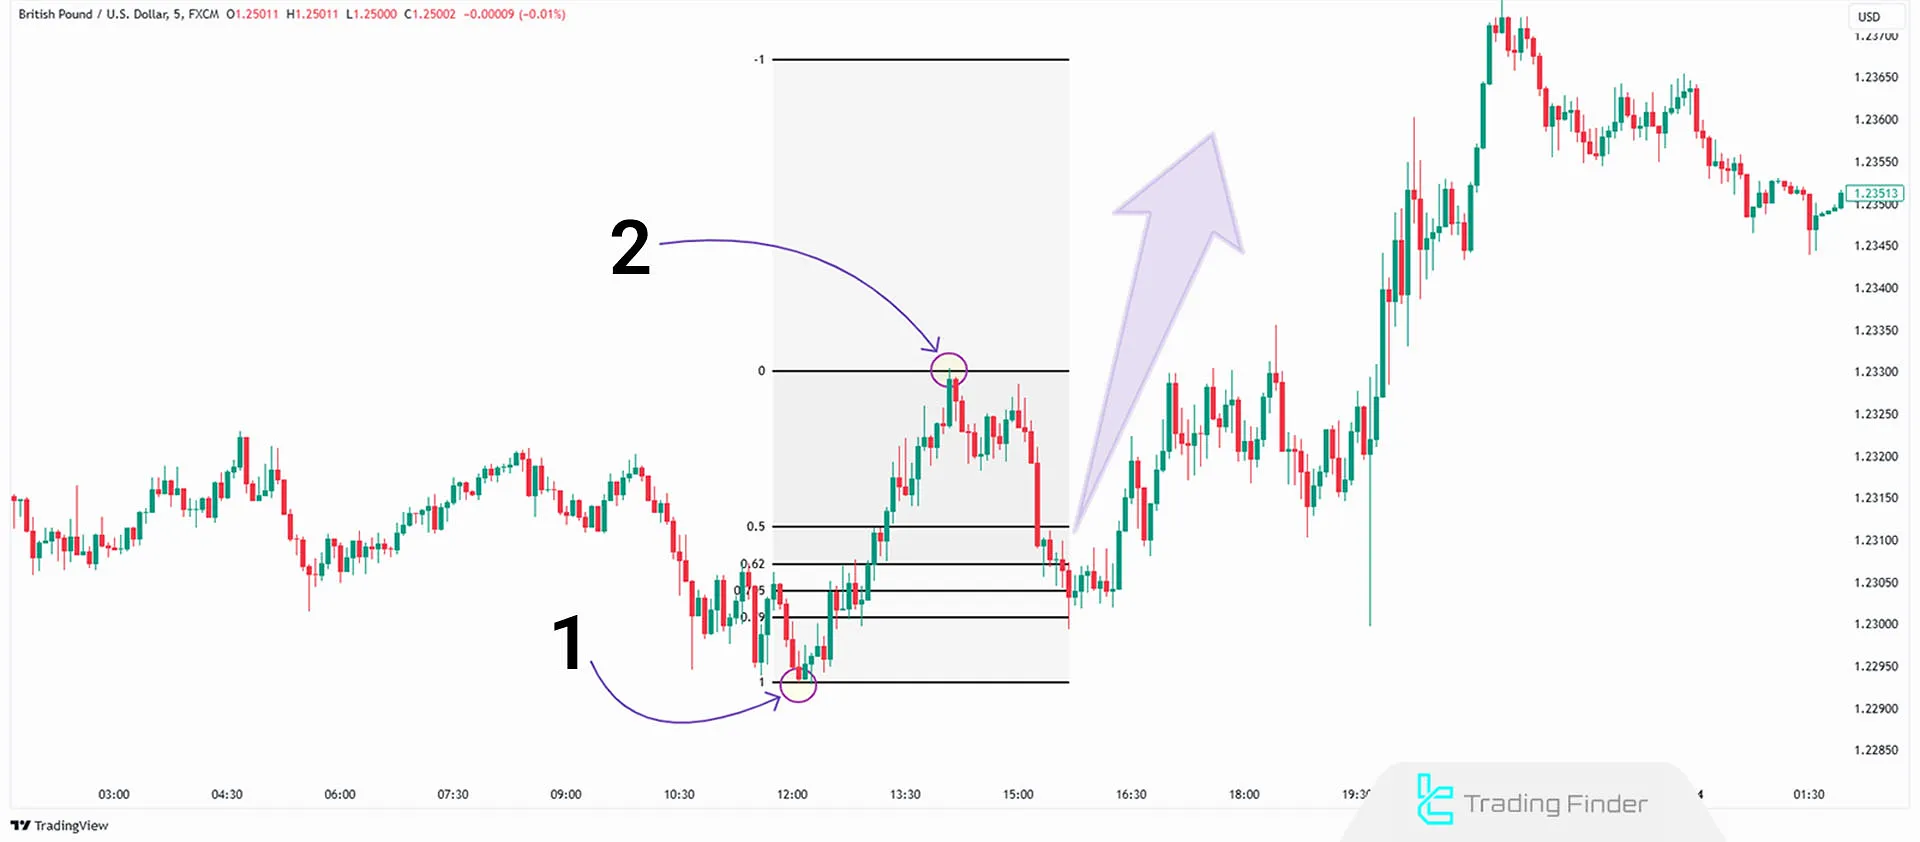
Bearish Range Example:
4. A Dynamic Tool for a Dynamic Market
As we discussed in the last lesson, price ranges are not static. When the market breaks a previous high or low (a Break of Structure), a new range is formed. This means you must update your Fibonacci drawing to reflect the new, relevant price leg.
Watch this final clip from ICT's video where he demonstrates this exact process of adjusting the Fibonacci tool as the market evolves.
ICT Mentorship Core Content - Month 1 - Equilibrium Vs. Discount
In this part of 'ICT Mentorship Core Content - Month 1 - Equilibrium Vs. Discount', Michael shows how to 'walk' the Fibonacci tool up with price as new impulsive swings are created.
Please watch from 00:21:26 to 00:24:48. Pay close attention to how he identifies a new price leg that shows strength and then draws a new Fibonacci on that specific leg to find the next equilibrium and discount entry point.
This demonstrates that marking premium and discount is an ongoing process of analysis, not a one-time setup.
5. Practical Exercise
It's time to apply this skill yourself.
- Go to your charting platform.
- Select a major pair like EUR/USD or GBP/USD on the 1-Hour (1H) timeframe.
- Ensure your Fibonacci tool is configured with the ICT levels.
- Find the most recent significant impulsive move (a strong rally or decline).
- Identify the swing high and swing low that created this move.
- Draw your Fibonacci tool on this range. Remember: low-to-high for a rally, high-to-low for a decline.
- Clearly label or note where the premium, discount, and equilibrium zones are.
- Look at where price has traded since the range was formed. Did it retrace into premium or discount? How did it react?
Spend about 15-20 minutes on this exercise. Try it on a few different price swings and even different timeframes to build your confidence.
Conclusion
Well done. You have now acquired a fundamental mechanical skill for ICT analysis. You can move beyond subjective guessing and use the Fibonacci tool to objectively define value in any price range.
Key Takeaways:
- The Fibonacci tool in ICT is used as a measuring device to divide a price range into premium (sell-side) and discount (buy-side) zones.
- The 0.5 level is the crucial equilibrium point that separates these two zones.
- For a bullish range, draw from low to high. For a bearish range, draw from high to low.
- You must constantly update your range and re-draw your Fibonacci tool as the market creates new swing highs and lows.
Preview of the Next Lesson:
Now that you can precisely mark premium and discount zones, the next logical question is: "What do I do with this information?" In our next and final lesson of this module, "Use premium and discount zones to select high-probability points of interest (POIs)," we will answer that. You will learn how to use these zones as a powerful filter to identify the most potent order blocks and fair value gaps, significantly increasing the probability of your trade setups.