Hello! Welcome to the final lesson of our module on Premium and Discount Arrays.
In the previous lesson, you mastered the essential mechanical skill of using the Fibonacci tool to precisely mark premium, discount, and equilibrium zones on a price range. You now have the "how." Today, we focus on the "why." This lesson is about transforming that simple measurement into a powerful strategic filter.
Our learning outcome is to use premium and discount zones to select high-probability points of interest (POIs). By the end of this session, you will understand how to use these zones to systematically filter for the best trading opportunities, dramatically increasing the quality of your trade selection process.
1. The Core Logic: Trading Like a Business
At its heart, trading is a business of speculation on price. The most fundamental business principle is "buy low, sell high." The ICT methodology applies this principle directly to the financial markets. "Smart Money" or institutional participants are not interested in buying an asset after its price has already risen significantly (at a premium), nor are they interested in selling it after it has already fallen sharply (at a discount).
Their goal is to:
- Accumulate long positions at a perceived wholesale or discounted price.
- Distribute short positions at a perceived retail or premium price.
As retail traders aiming to align with institutional order flow, our strategy should be the same. This means:
- When our analysis suggests a bullish directional bias, we should look for buying opportunities only when the price retraces into a discount zone.
- When our analysis suggests a bearish directional bias, we should look for selling opportunities only when the price retraces into a premium zone.
This simple filter prevents us from chasing price and entering trades with poor risk-to-reward ratios. Let's see how this concept directly impacts trade viability.
Discount & Premium - ICT Concepts
The video 'Discount & Premium - ICT Concepts' by TTrades provides a clear explanation of the strategic advantage gained by trading within these zones.
Watch from 01:30 to 02:33. Pay close attention to the explanation of how entering in a deep discount (for longs) or deep premium (for shorts) improves your potential risk-to-reward ratio compared to entering at equilibrium.
2. The PD Array: What Are We Looking For?
Now that we know where to look (premium or discount zones), the next question is what are we looking for?
We are looking for Points of Interest (POIs). A POI is a specific price level where we anticipate a significant reaction that could initiate a trade. ICT provides a specific list of these POIs, and the collection of these points within the premium and discount framework is called the PD Array (Premium/Discount Array).
Think of the PD Array as a checklist of high-probability patterns to hunt for inside your premium or discount zones.
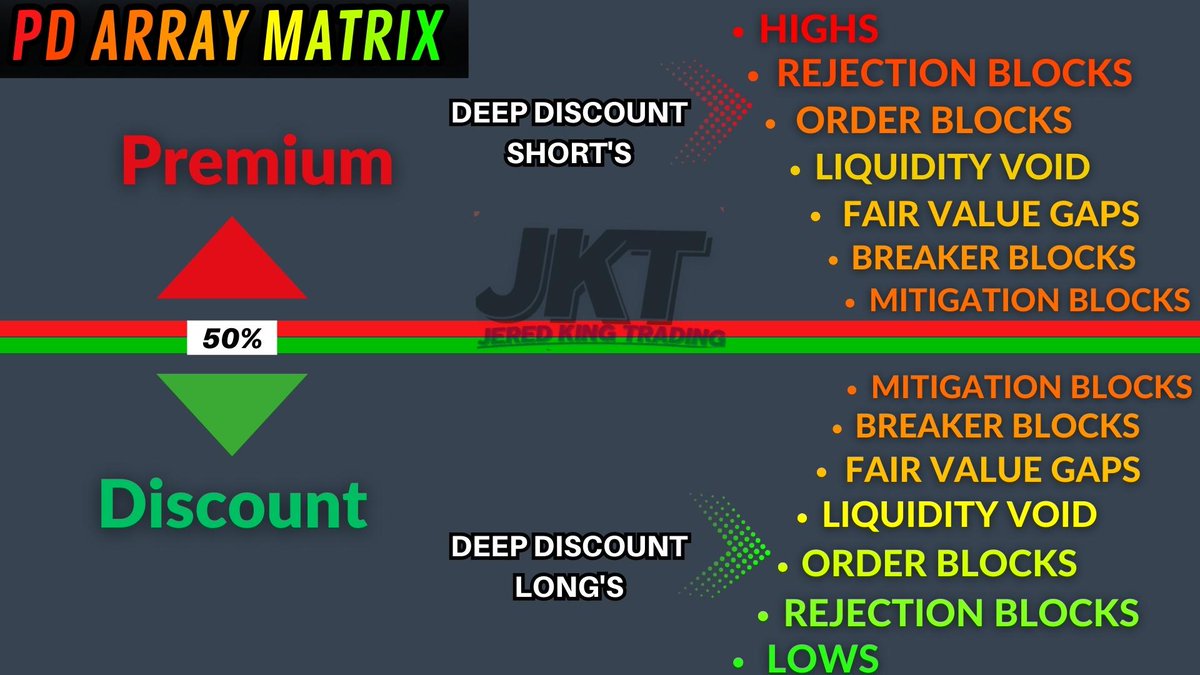
The primary components of a PD Array include:
- Order Blocks (OBs)
- Fair Value Gaps (FVGs)
- Breaker Blocks (BBs)
- Mitigation Blocks (MBs)
- Liquidity Voids
- Rejection Blocks
Don't worry about mastering the identification of all these just yet. We will dedicate entire future lessons and modules to each of them, starting with Order Blocks in our very next module. For today, the key is to understand that these are the specific patterns you will be searching for within your premium or discount zones.
The following text provides a solid overview of what a PD Array is and lists its core components.
ICT PD Array Matrix - Key to Trade Execution
The article 'ICT PD Array Matrix' from ICT Trading offers a concise definition and breakdown of the PD Array concept.
Read the sections 'What is ICT PD Array Matrix?', 'How to Identify the ICT PD Arrays?', and 'Types of ICT PD Arrays'. This will solidify your understanding of the concept and formally introduce bullish vs. bearish arrays.
3. A Hierarchy of POIs: Not All POIs Are Equal
When you look inside a premium or discount zone, you may find multiple potential POIs. For example, you might see a Fair Value Gap and an Order Block close to each other. Which one is more likely to be respected?
While context is always key, ICT provides a general hierarchy. This helps you prioritize which level to watch more closely.
PD Array Matrix: Top-Down Analysis for Crypto Trading
This article from Altrady, 'PD Array Matrix: Top-Down Analysis', provides an excellent breakdown of how to prioritize different POIs.
Please read the subsection titled 'Priority Rules'. It outlines a clear hierarchy: Liquidity > Fair Value Gaps > Order Blocks. This is a crucial concept for refining your analysis and choosing the most probable level for a reaction.
Key Priority Rule: Liquidity is the primary driver of the market. Therefore, a POI that is aligned with a liquidity pool (e.g., an order block just below a pool of sell-side liquidity) is generally considered a higher-probability POI.
4. Selecting POIs in Practice: A Step-by-Step Example
Let's bring everything together and see how this works on a real chart. The process is a logical sequence:
- Establish Directional Bias: For this example, let's assume our higher timeframe analysis suggests the market is bullish.
- Identify the Trading Range: Find the impulsive leg of price that confirms this bias and draw your Fibonacci from the low to the high.
- Isolate the Discount Zone: Mark the area below the 50% equilibrium level.
- Scan for POIs: Look for bullish PD Arrays (like a Fair Value Gap or a Bullish Order Block) within that discount zone.
- Anticipate a Reaction: Monitor price as it trades down into your high-probability POI within the discount zone.
This video demonstrates this exact process.
Discount & Premium - ICT Concepts
Let's return to the 'Discount & Premium - ICT Concepts' video to see a practical application of these steps.
Watch the example on the NASDAQ daily chart from 02:33 to 03:32. Notice how the presenter first identifies a bullish range, marks the discount zone, and then locates a Fair Value Gap (a PD array) inside that discount zone as the high-probability entry area.
By waiting for price to trade down to a specific POI within a discount zone, you combine Price (the specific POI level) with Value (the discount context). This confluence is the foundation of high-probability ICT trading.
5. Practical Exercise
Now it's your turn to apply this strategic filter.
- Open your charting platform to a major pair like GBP/USD on the 4-Hour (4H) timeframe.
- Find a clear and recent major trend (either bullish or bearish).
- Draw your Fibonacci tool across the main swing that defines this trend.
- Based on the trend, identify the correct zone to look for entries (Premium for shorts, Discount for longs).
- Now, carefully scan only that zone. Look for evidence of potential POIs you've heard about today:
- Any large, gappy candles that create an imbalance (Fair Value Gap)?
- The last down-candle before a strong up-move, or the last up-candle before a strong down-move (Order Block)?
- Mark these potential POIs on your chart. Observe how price behaved if and when it returned to these levels.
Spend about 15 minutes on this exercise. The goal isn't to be perfect at identifying POIs yet, but to train your eyes to filter the chart and focus only on the highest-probability areas.
Conclusion
Congratulations on completing the "Premium and Discount Arrays" module. You have moved from simple observation to strategic application. You now possess a robust framework for determining value within the market.
Key Takeaways:
- Premium and Discount zones act as a fundamental filter for trade selection.
- In a bullish market, we look for entry opportunities at POIs located in a discount.
- In a bearish market, we look for entry opportunities at POIs located in a premium.
- The PD Array is the checklist of ICT patterns (Order Blocks, FVGs, etc.) that we hunt for within these zones.
- Combining a specific POI with the context of premium or discount creates a high-probability trade setup with a favorable risk-to-reward profile.
Preview of the Next Lesson:
This lesson has set the stage perfectly for our next module, "Order Blocks and Institutional Arrays." You now understand where to look for the most powerful setups. In our very next lesson, we will begin to define what you are looking for in detail, starting with the cornerstone of ICT analysis: the Order Block. You will learn what it represents, how to identify bullish and bearish order blocks, and why they are such powerful turning points in the market.