Hello! Welcome to your third lesson in the "Premium and Discount Arrays" module.
In our last lesson, we defined premium and discount zones and established the core institutional logic behind them: buy cheap (at a discount) and sell expensive (at a premium). You learned that the 50% equilibrium level of a price range is the dividing line between these two states of value.
Today, we will move from theory to observation. The learning outcome is to identify when price is trading at a premium versus a discount. This is the practical skill of looking at a chart, contextualizing the current price within a relevant range, and determining whether it's in an area favorable for buying or selling. This skill is the bridge between understanding the concept and actually using it to find trade setups.
1. The Core Principle: A Quick Recap
Before we begin, let's visually reinforce the concepts from our last lesson.

The core idea is that "smart money" is less likely to initiate large buy orders when price is expensive (in premium) and less likely to sell when it's cheap (in discount). Our goal is to train our eyes to see the market through this same lens of value.
2. The Logic of Location: Why It Matters
Identifying whether price is at a premium or discount isn't just a labeling exercise; it's a critical filter for decision-making. ICT's methodology is built on finding high-probability scenarios, and trading from the "wrong" zone (e.g., buying in premium) is considered inherently low-probability.
Let's watch a segment from ICT's core content where he explains this.
ICT Mentorship Core Content - Month 1 - Equilibrium Vs. Discount
In this video, 'ICT Mentorship Core Content - Month 1 - Equilibrium Vs. Discount', Michael Huddleston himself explains why the location of price relative to equilibrium is so crucial for framing high-probability trades.
Please watch from 00:11:13 to 00:13:36. Pay close attention to how he distinguishes between being at 'fair market value' (equilibrium) and being at a 'discount'. Notice his emphasis that you are looking for buying opportunities after price has moved into the discount zone.
As you heard, price entering a discount zone is the prerequisite for seeking bullish setups. The same logic applies in reverse for bearish setups in a premium zone.
3. The Identification Process: A Step-by-Step Guide
So, how do we do this in practice? It's a simple, repeatable process.
- Define the Current Trading Range: First, you must identify the significant price swing you are analyzing. This is typically the most recent impulsive move, framed by a clear swing high and swing low.
- Locate the 50% Equilibrium Level: Find the midpoint of that range. For now, you can visually estimate this point. In our next lesson, we'll use a specific tool to do this with precision.
- Observe the Current Price: Look at where the current candle is forming. Is it above or below your estimated 50% level?
- If above, the price is trading at a premium.
- If below, the price is trading at a discount.
This short video demonstrates this exact process.
Discount & Premium - ICT Concepts
The video 'Discount & Premium - ICT Concepts' by TTrades provides a very clear and quick demonstration of identifying these zones on a chart.
Watch the segment from 00:00:28 to 00:01:19. Notice how the presenter first identifies a range (from a high to a low), then marks the 0.5 level (equilibrium), and finally labels the areas above and below it as premium and discount.
Here is another example on a static chart:
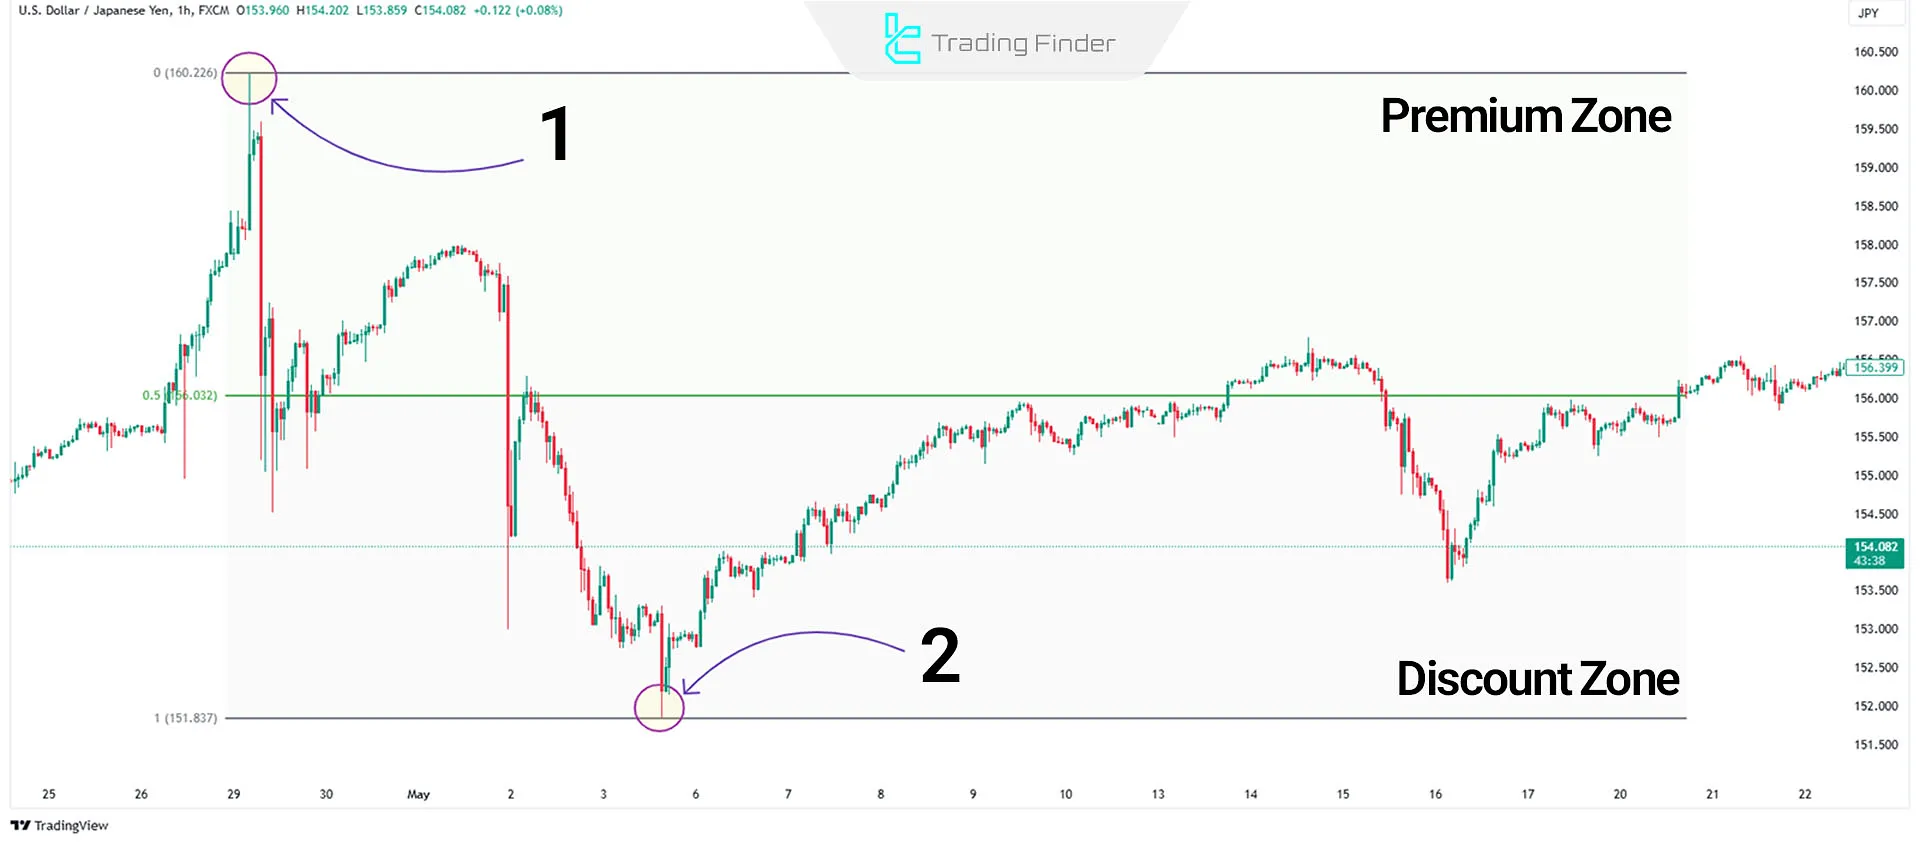
4. An Essential Rule: Ranges Are Dynamic
A common mistake for new traders is to anchor to an old price range that is no longer relevant. The market is constantly evolving. When price breaks the high or low of your current range—what we've previously called a Break of Structure (BOS)—a new range is established. You must then update your analysis to this new range.
This article explains this point well.
ICT Premium and Discount Zone Identification - ICT Trading
The article 'ICT Premium and Discount Zone Identification' explains the importance of updating your range after a structural break.
Please read the section titled 'Does Premium and Discount Zone Change after Break of Structure?'. This is a short but critical section that explains how to adjust your range in both bullish and bearish trends.
The key takeaway is:
- In a bullish trend, after a BOS to the upside, your new range is from the swing low that initiated the break to the new swing high.
- In a bearish trend, after a BOS to the downside, your new range is from the swing high that initiated the break to the new swing low.
5. Practical Application
Now it's your turn to practice this observational skill.
- Open your charting platform (e.g., TradingView).
- Choose a major forex pair like EUR/USD or an index like the S&P 500 (US500).
- Use the 4-hour or Daily timeframe.
- Identify the most recent, clear impulsive price swing and its swing high and swing low.
- Visually estimate the 50% equilibrium level of this range.
- Ask yourself: Is the current price trading at a premium or a discount relative to this range?
This simple exercise will begin to train your eye to categorize price action according to value, which is a foundational skill for all the ICT models you will learn later.
Conclusion
Excellent work. You have now learned the practical skill of identifying whether price is trading in a premium or discount environment. This moves you one step closer to making informed, high-probability trading decisions.
Key Takeaways:
- Identifying premium vs. discount is a 3-step process: Define the range, locate equilibrium, and observe the current price.
- A bullish bias should prompt you to wait for price to enter a discount zone before looking for buy setups.
- A bearish bias should prompt you to wait for price to enter a premium zone before looking for sell setups.
- Price ranges are dynamic. You must update your range analysis after every Break of Structure (BOS) to remain in sync with the market.
Preview of the Next Lesson:
While visually estimating the 50% level is good for practice, professional trading requires precision. In our next lesson, "Use the Fibonacci tool to mark premium and discount zones on a price range," you will learn the exact technical skill of applying and configuring the Fibonacci tool to mark these zones quickly and accurately on your charts.