Welcome to the second module of our course, where we shift from visualizing data to understanding the fundamental engine of motion: calculus. In our last lesson, you mastered how to plot multiple datasets, creating dashboards to compare flight parameters like altitude and velocity. You saw how these quantities change over time, but we relied on predefined formulas. To build a true simulation that can handle complex, changing forces, we need a way to describe and calculate change from one moment to the next.
This lesson introduces the cornerstone of that process: the derivative. Your goal is to define the derivative as the instantaneous rate of change. This concept is the mathematical key that unlocks our ability to simulate how a rocket's state—its position, velocity, and more—evolves through time. We will build this idea from the ground up, starting with an intuitive analogy, moving to a geometric picture, and finally, connecting it to a practical Python implementation that you will use in your future simulations.
From Average Speed to Instantaneous Speed
You're already familiar with the idea of a rate of change from your physics background. When you calculate a car's speed by dividing the distance traveled by the time it took, you are finding its average speed.
Average Speed = (Change in Position) / (Change in Time)
This gives you a single number for the entire trip. But what if you want to know your speed at one specific moment—the speed your car's speedometer shows? That's the instantaneous speed. The derivative is the mathematical tool for finding exactly this: the rate of change at a single instant.
The following article uses this speedometer analogy to build a fantastic intuition for what a derivative represents.
Intuition Behind Derivatives — The Speedometer Story - Medium
This article provides an excellent analogy to help you grasp the core concept of a derivative as an instantaneous rate of change, contrasting it with the more familiar idea of an average rate of change.
Please read the first two main sections of the article: Start from the beginning and read The Speedometer section. This introduces the core analogy. Continue with the next section, From Average Speed to Instantaneous Speed. Notice how the author moves from calculating average speed over large intervals to suggesting the need to look at "smaller and smaller time intervals" to find the speed at an exact moment.
This idea of shrinking the time interval is the conceptual leap from algebra to calculus. To find the rate of change at a single point, we start by calculating the average rate over a small interval around that point and then imagine making that interval infinitely small.
A Geometric View: Slope of the Tangent Line
We can visualize this concept on a graph. For a straight line, the slope is constant; the rate of change is the same everywhere. But for a curve, like the trajectory of a rocket, the steepness—and thus the rate of change—is constantly varying.
The average rate of change between two points on a curve is simply the slope of the straight line connecting them. This line is called a secant line.
To find the instantaneous rate of change at a single point, we can imagine moving the two points of the secant line closer and closer together. As the distance between the points approaches zero, the secant line pivots to become the tangent line—a line that just touches the curve at that one point. The slope of this tangent line is the derivative at that point.
The following video from Khan Academy explains this geometric interpretation very clearly.
Derivative as a concept | Derivatives introduction | AP Calculus AB | Khan Academy
This video builds the concept of the derivative by starting with the familiar idea of the slope of a line and extending it to find the "slope" of a curve at a single point.
Please watch the first part of the video, from the beginning up to the formal introduction of the term "derivative." Focus on how Sal Khan explains the difference between the slope of a secant line (average rate of change) and the slope of a tangent line (instantaneous rate of change).
This next short, animated video provides a dynamic visualization of a secant line transforming into a tangent line. This visual can be very helpful for cementing the concept.
This animation shows the transition from a chord (secant line) to a tangent line as the interval shrinks.
Watch the segment from this point. It uses the analogy of a hill's slope. Observe how the slope of the chord becomes a better and better approximation of the hill's steepness at a single point as the two points get closer.
The image below summarizes this entire process. On the left, we calculate an average rate of change over a noticeable interval, . On the right, we see what happens as we shrink that interval towards zero: the average rate becomes the instantaneous rate at a single point.
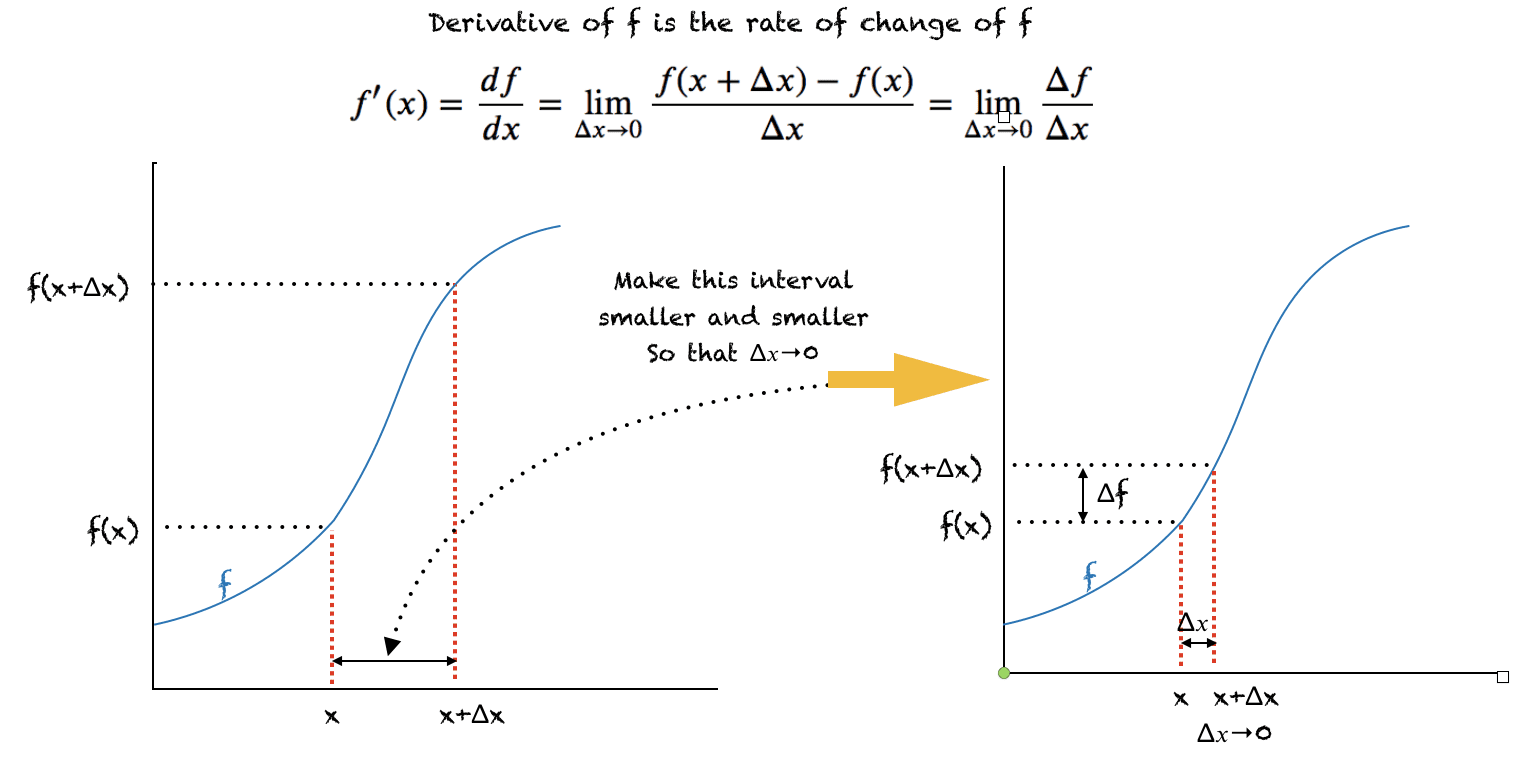
A visual representation of the derivative. The average rate of change between and , given by the slope of the secant line, approaches the instantaneous rate of change at , given by the slope of the tangent line, as the interval shrinks to zero.
The Formal Definition and Numerical Approximation
Mathematically, this process of "shrinking the interval to zero" is called taking a limit. The formal definition of the derivative of a function , denoted as (read "f prime of x"), is:
Let's break this down:
- is the value of your function at some point .
- (delta x) is a small change in the input, our "interval".
- is the value of the function a small step away.
- The numerator, , is the change in the function's value, which we can call .
- The fraction is the average rate of change over that small interval (rise over run).
- The part means we are finding the value that this fraction approaches as our interval gets infinitesimally small. This gives us the instantaneous rate of change.
Another common notation for the derivative, introduced by Leibniz, is . This notation is very evocative of its origin as the limit of .
For our rocket simulations, we can't make the time step infinitely small. Instead, we will do what the definition implies: we'll make it very small. This gives us a numerical approximation of the derivative, which is perfect for a step-by-step computer simulation.
This next resource provides a concise walkthrough of this idea, complete with a Python implementation.
Basic Derivatives | CodeSignal Learn
This article from CodeSignal bridges the gap from the theoretical concept of a derivative to a practical, numerical approximation in code.
Please read the following sections: Start with the section Calculating an Approximation. This shows how choosing a smaller \Delta x leads to a better approximation. Finally, review the section Implementing a Derivative in Python. This introduces a simple function to calculate the derivative numerically.
Let's look at the Python function from that article. It's an implementation of the forward difference method, a common way to approximate a derivative.
import numpy as np

def f(x):
  """A simple quadratic function for demonstration."""
  return x**2

def approximate_derivative(func, x, h):
  """
  Calculates the approximate derivative of a function at a point x.

  Args:
    func: The function to differentiate (e.g., f).
    x: The point at which to find the derivative.
    h: A very small step size (our delta_x).

  Returns:
    The approximate derivative at x.
  """
  return (func(x + h) - func(x)) / h

# --- Calculate the derivative of f(x) = x^2 at x = 2 ---
x_point = 2
h = 1e-6 # A small step size, equivalent to 0.000001

# Calculate the approximation
deriv_at_2 = approximate_derivative(f, x_point, h)

print(f"The function is f(x) = x^2")
print(f"The approximate derivative at x = {x_point} is: {deriv_at_2}")

# The exact analytical derivative of x^2 is 2x. At x=2, the exact derivative is 4.
# Our approximation is very close!
This simple function is incredibly powerful. It can find the instantaneous rate of change for any function func you give it, at any point x. This is the core mechanism we will use to update our rocket's state in our simulations. By knowing the rocket's position at one moment, we can calculate its velocity (the derivative of position), and use that to predict its position a fraction of a second later.
Conclusion
In this lesson, you have been introduced to the fundamental concept of the derivative. We moved from an intuitive understanding to a precise mathematical definition, and finally to a practical implementation in code.
Here are the key takeaways:
- A derivative measures the instantaneous rate of change of a function at a specific point.
- Geometrically, the derivative is the slope of the tangent line to the function's graph at that point.
- The derivative is formally defined as the limit of the average rate of change () as the interval () shrinks to zero.
- In simulations, we approximate the derivative numerically by using a very small but finite step size, .
You now have the primary mathematical tool needed to describe motion. In the next lesson, we will apply this concept directly to the physics of our simulation. We will formally define velocity as the derivative of position with respect to time, and acceleration as the derivative of velocity with respect to time. This connection is the heart of simulating motion and will be our next step toward building our rocket simulation.

A preview of our next topic: the relationships between position, velocity, and acceleration, which are mathematically defined by derivatives.