In our previous lesson, you learned the fundamentals of Matplotlib, turning raw data into clear, labeled plots. You even got a first look at comparing two datasets by plotting two projectile trajectories on the same graph. This lesson builds directly on that foundation, equipping you with a full suite of techniques for visualizing and comparing the different parameters of a rocket's flight.
Your goal is to simulate rocket motion, and a key part of that is analyzing how quantities like altitude, velocity, acceleration, and mass change over time and relate to one another. Simply printing these numbers isn't enough; we need to see them graphically. This lesson will teach you how to plot multiple datasets on a single figure, a crucial skill for comparing these flight parameters. We will cover three primary methods:
- Plotting multiple lines on the same axes for direct comparison.
- Using separate, stacked subplots for clarity when comparing different types of data.
- Employing multiple y-axes when datasets have vastly different scales.
By the end of this lesson, you'll have a complete visualization toolkit to analyze the results of the simulations we'll be building.
Method 1: Multiple Lines on the Same Axes
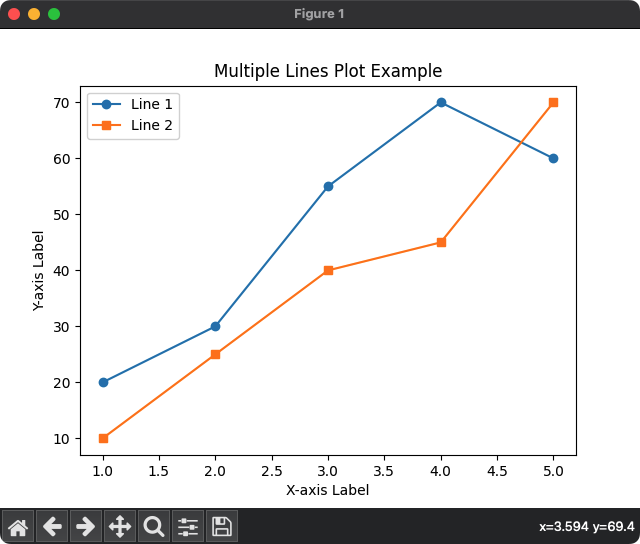
In the last lesson, you saw that you can plot multiple lines by simply calling plt.plot() several times before plt.show(). This is the most direct way to compare datasets that share the same units or have similar scales, like comparing the median salaries for different developer roles.
The following video from Corey Schafer provides an excellent, practical walkthrough of this technique. It reinforces what you've learned and adds important details about customizing lines to make your plots more readable.
Matplotlib Tutorial (Part 1): Creating and Customizing Our First Plots
This video demonstrates how to plot multiple lines on the same axes and customize their appearance for clarity.
Please watch these two segments: First, watch the section on plotting multiple lines. Pay close attention to his preferred method of adding labels directly within the plot command and then calling an empty plt.legend(). This is a robust and readable practice. Next, watch the segment on formatting and styling. This shows how to control color, line style, and line width, which are essential for distinguishing different datasets.
Let's apply this to a simple flight scenario. Imagine we have data for a rocket's altitude and its velocity during the first few seconds of ascent. Both are measured against time.
import numpy as np
import matplotlib.pyplot as plt


# --- 1. Generate Sample Flight Data ---
time = np.linspace(0, 10, 100) # Time from 0 to 10 seconds


# Simplified kinematics (these are not from a real simulation yet)
# Altitude increases quadratically (like s = 1/2*a*t^2)
altitude = 2.5 * time**2


# Velocity increases linearly (like v = a*t)
velocity = 5 * time


# --- 2. Create the Plot ---
plt.figure(figsize=(10, 6)) # Create a figure with a nice size


# Plot altitude vs. time
plt.plot(time, altitude, label="Altitude (m)", color="blue", linestyle="-")


# Plot velocity vs. time on the same axes
plt.plot(time, velocity, label="Velocity (m/s)", color="green", linestyle="--")


# --- 3. Add Annotations ---
plt.title("Rocket Ascent Profile (First 10 Seconds)")
plt.xlabel("Time (s)")
plt.ylabel("Value") # A generic label since units differ, a known limitation
plt.legend()
plt.grid(True)

plt.show()
When you run this code, you'll see both altitude and velocity plotted together. While useful, you might notice a potential issue: if the scales of the data were very different (e.g., altitude in thousands of meters and velocity in tens of m/s), one line might look almost flat and be hard to interpret. This leads us to our next technique.
Method 2: Handling Different Scales with Multiple Y-Axes
Consider plotting a rocket's temperature (in Kelvin) and the atmospheric density (in kg/m³). Temperature might be in the hundreds or thousands, while density is a small number, often less than 1. Plotting these on the same y-axis would render the density curve invisible. The solution is to create a second y-axis on the opposite side of the plot.
This technique, often called "twin axes," allows two datasets with different scales to be overlaid and compared against a common x-axis.

To implement this, we need to use Matplotlib's "object-oriented" interface, where we explicitly create figure and axes objects. This gives us more control. The key function is ax.twinx(), which creates a new y-axis that shares the same x-axis.
The following reading provides a concise, physics-based example of plotting speed and position on the same graph using this method.
Plotting Functions in Python - James Hedberg
This tutorial shows the code required to create a plot with two y-axes.
Please read the code block found under the text this heading. Pay close attention to these key steps: fig, ax1 = plt.subplots() creates the figure and the first axes object. ax2 = ax1.twinx() creates the second axes object that shares the x-axis. Data is plotted separately using ax1.plot(...) and ax2.plot(...). Labels and colors are set for each axis independently to avoid confusion.
Let's adapt our previous rocket example to use twin axes. This will give both altitude and velocity their own, properly scaled y-axis.
import numpy as np
import matplotlib.pyplot as plt

time = np.linspace(0, 10, 100)
altitude = 2.5 * time**2
velocity = 5 * time


# --- Create figure and first y-axis ---
fig, ax1 = plt.subplots(figsize=(10, 6))


# Plot Altitude on the first y-axis (ax1)
color = 'tab:blue'
ax1.set_xlabel('Time (s)')
ax1.set_ylabel('Altitude (m)', color=color)
ax1.plot(time, altitude, color=color)
ax1.tick_params(axis='y', labelcolor=color)


# --- Create the second y-axis that shares the x-axis ---
ax2 = ax1.twinx()


# Plot Velocity on the second y-axis (ax2)
color = 'tab:green'
ax2.set_ylabel('Velocity (m/s)', color=color)
ax2.plot(time, velocity, color=color, linestyle="--")
ax2.tick_params(axis='y', labelcolor=color)


# --- Final Touches ---
plt.title("Rocket Ascent Profile with Dual Y-Axes")
fig.tight_layout() # Adjusts plot to prevent labels from overlapping
plt.grid(True)
plt.show()
This plot is much clearer. Each curve uses the full range of its respective y-axis, making trends easy to see.
Method 3: Organizing with Subplots
Sometimes, overlaying plots—even with twin axes—can become cluttered. A more organized approach for comparing several different flight parameters is to use subplots. This creates a grid of separate plots within a single figure. For flight analysis, it's extremely common to have a stack of plots all sharing the same time axis.
This method also relies on the object-oriented interface. The command plt.subplots(nrows, ncols) creates a figure and returns an array of axes objects that you can plot on individually.
This is a powerful and widely used feature. Corey Schafer's tutorial on subplots provides a fantastic introduction to the concept.
Matplotlib Tutorial (Part 10): Subplots
This video explains the motivation for subplots and demonstrates how to create and manage them.
Watch the following segments to master this technique: First, understand the concept of subplots. The video explains the difference between the simple plt.plot() approach and the more powerful object-oriented fig, ax = plt.subplots() method. Next, see how to create and plot on multiple axes. This shows how subplots(nrows=2, ncols=1) returns multiple ax objects that you can plot on individually. Finally, learn how to clean up the plots by removing redundant labels and, most importantly, using the sharex=True argument. This is the key to creating clean, comparable time-series plots.
Now, let's create a standard flight analysis dashboard: three stacked plots showing altitude, velocity, and acceleration vs. time. We'll generate some sample data for a rocket launch with constant acceleration.
import numpy as np
import matplotlib.pyplot as plt


# --- 1. Generate Data for a Simple Launch ---
time = np.linspace(0, 10, 100)
a = 20.0 # Constant acceleration (m/s^2)


# Kinematic equations
acceleration = np.full_like(time, a) # Constant acceleration
velocity = a * time
altitude = 0.5 * a * time**2


# --- 2. Create a Figure with 3 Stacked Subplots sharing an X-axis ---
# nrows=3, ncols=1. `sharex=True` links the time axis for all plots.
# `figsize` adjusts the overall size to be taller.
fig, axs = plt.subplots(3, 1, sharex=True, figsize=(8, 10))


# --- Add a single, overarching title for the whole figure ---
fig.suptitle('Rocket Launch Analysis')


# --- Plot 1: Altitude ---
axs[0].plot(time, altitude, color='blue')
axs[0].set_ylabel('Altitude (m)')
axs[0].grid(True)


# --- Plot 2: Velocity ---
axs[1].plot(time, velocity, color='green')
axs[1].set_ylabel('Velocity (m/s)')
axs[1].grid(True)


# --- Plot 3: Acceleration ---
axs[2].plot(time, acceleration, color='red')
axs[2].set_ylabel('Acceleration (m/s²)')
axs[2].set_xlabel('Time (s)') # Only need x-label on the bottom plot
axs[2].grid(True)


# --- Adjust layout to prevent titles/labels overlapping ---
plt.tight_layout(rect=[0, 0, 1, 0.96]) # Adjust for suptitle
plt.show()
The resulting figure is a clean, professional-looking dashboard. Because the x-axes are shared, you can easily trace a vertical line at any point in time to see the corresponding altitude, velocity, and acceleration. This is exactly the kind of analysis tool you will need for your future simulations.
Conclusion
You have now completed the "Foundations" module and have a powerful set of tools for both computation and visualization. In this lesson, you've mastered three essential techniques for comparing data, which will be the cornerstone of analyzing your simulation results.
Here are the key takeaways:
- Multiple Lines: Use multiple
plt.plot()calls for direct comparison of datasets with similar scales. Always use legends and distinct line styles for clarity. - Multiple Y-Axes: Use
ax.twinx()when comparing two datasets with very different scales on the same plot. This requires the object-oriented Matplotlib interface. - Subplots: Use
plt.subplots(rows, cols, sharex=True)to create an organized grid of plots. This is the best method for comparing several different flight parameters against time without clutter.
With your knowledge of NumPy for data handling and Matplotlib for visualization, you are now ready to tackle the core physics of motion. Our previous work has relied on simple analytical formulas. To build a true, step-by-step rocket simulation that can handle complex forces like drag and thrust, we need to understand the mathematics of change.
In the next module, we will begin our exploration of calculus. We'll start by defining the derivative as an instantaneous rate of change. This fundamental concept is the mathematical bridge that connects position, velocity, and acceleration, and it is the key to simulating how a rocket's state evolves from one moment to the next.